7
7peptides
spectra
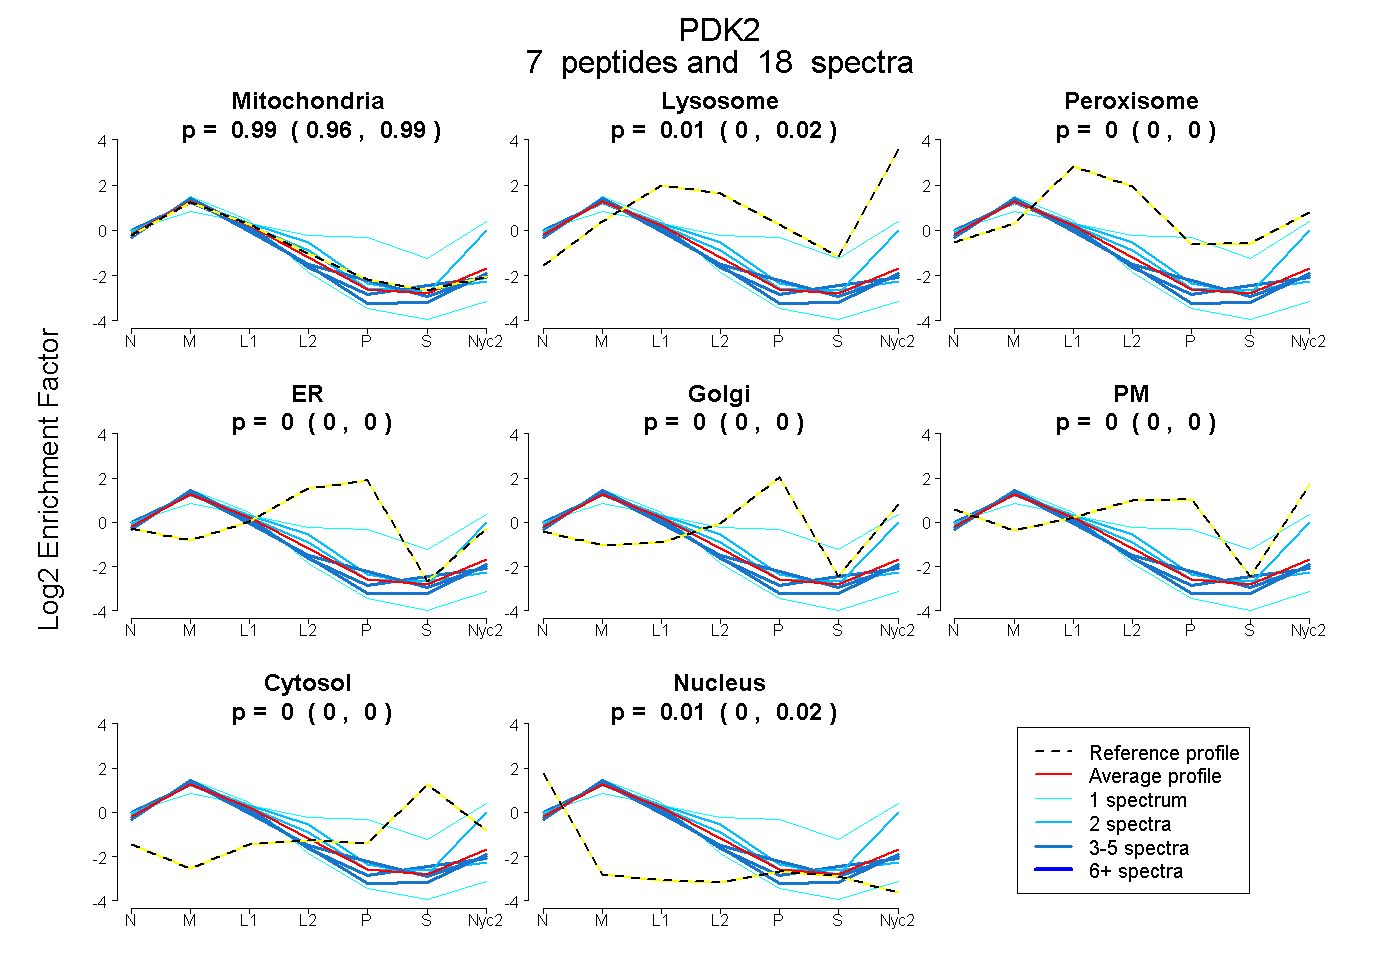
0.961 | 0.994
0.000 | 0.022
0.000 | 0.000
0.000 | 0.000
0.000 | 0.000
0.000 | 0.000
0.000 | 0.000
0.003 | 0.016
3peptides
spectra
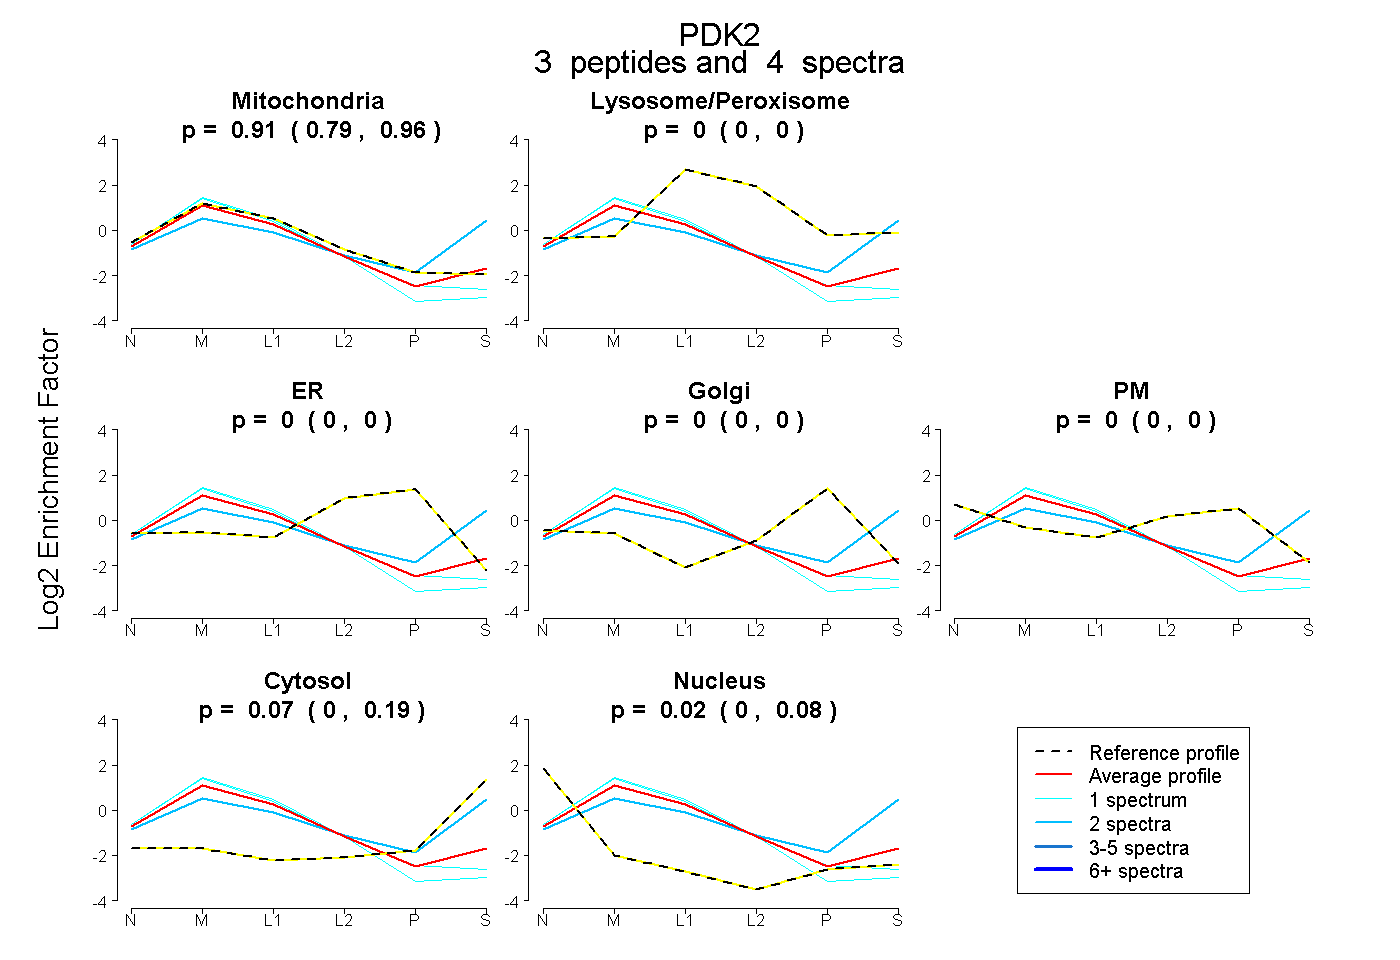
0.788 | 0.957
0.000 | 0.000
0.000 | 0.000
0.000 | 0.000
0.000 | 0.000
0.000 | 0.189
0.000 | 0.081
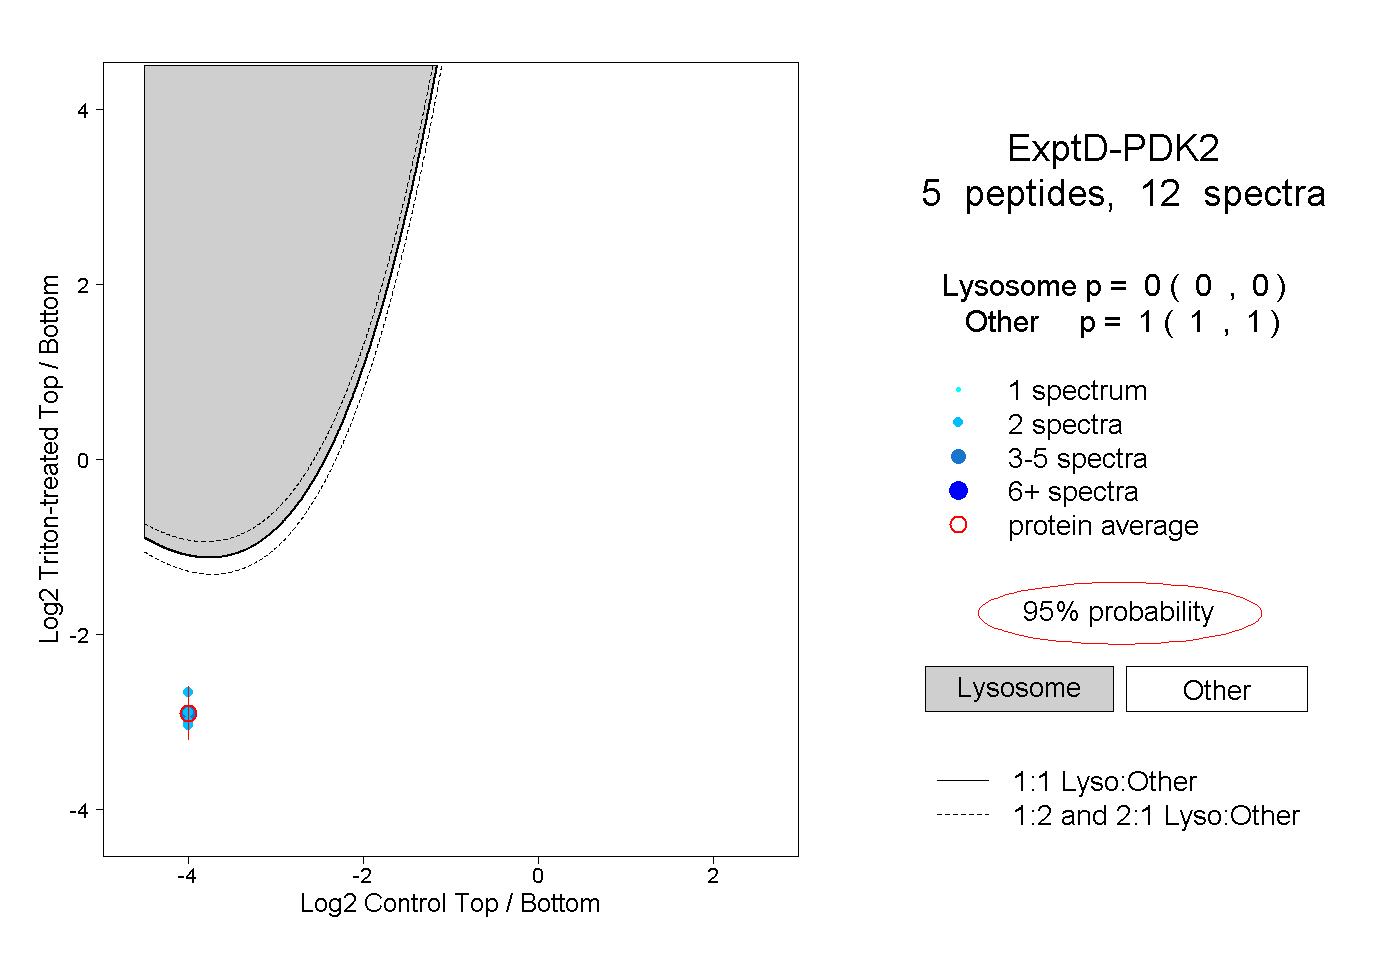
9peptides
spectra
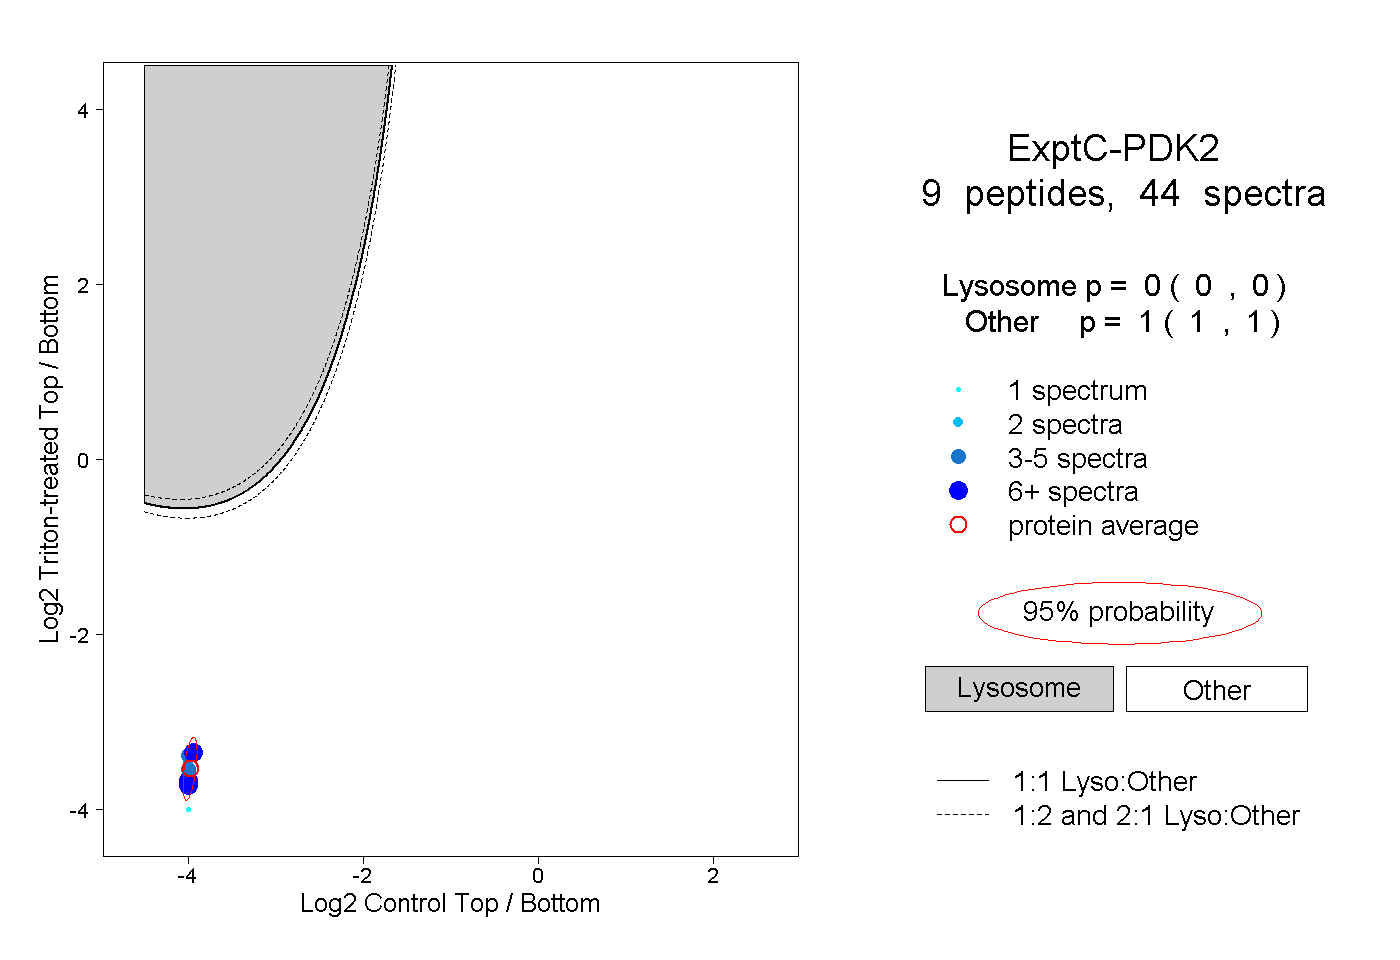
0.000 | 0.000
1.000 | 1.000