 7
7peptides
spectra
0.961 | 0.994
0.000 | 0.022
0.000 | 0.000
0.000 | 0.000
0.000 | 0.000
0.000 | 0.000
0.000 | 0.000
0.003 | 0.016
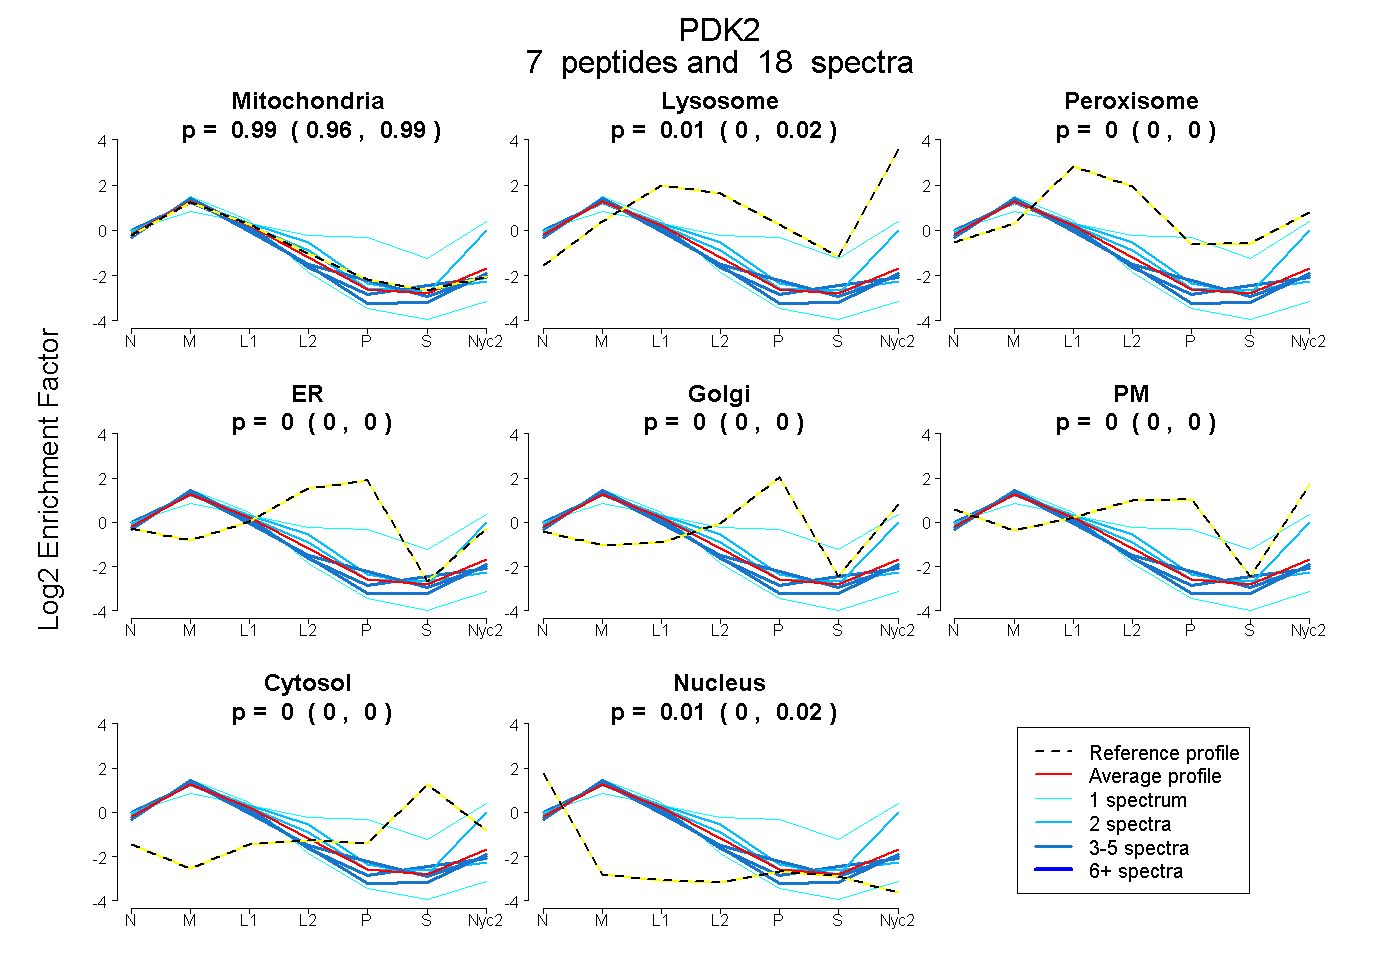
| Plot | Mito | Lyso | Perox | ER | Golgi | PM | Cytosol | Nucleus | |||||
| Expt A |
7 peptides |
18 spectra |
|
0.985 0.961 | 0.994 |
0.006 0.000 | 0.022 |
0.000 0.000 | 0.000 |
0.000 0.000 | 0.000 |
0.000 0.000 | 0.000 |
0.000 0.000 | 0.000 |
0.000 0.000 | 0.000 |
0.009 0.003 | 0.016 |
| 2 spectra, QFLDFGSSNACEK | 0.745 | 0.239 | 0.000 | 0.000 | 0.000 | 0.000 | 0.000 | 0.016 | ||
| 1 spectrum, HNDVVPTMAQGVIEYK | 0.386 | 0.192 | 0.011 | 0.000 | 0.000 | 0.299 | 0.112 | 0.000 | ||
| 4 spectra, TSFTFLR | 0.959 | 0.000 | 0.000 | 0.000 | 0.000 | 0.000 | 0.000 | 0.041 | ||
| 1 spectrum, IMVALGEEDLSIK | 0.931 | 0.000 | 0.000 | 0.000 | 0.000 | 0.000 | 0.000 | 0.069 | ||
| 4 spectra, EINLLPDR | 0.939 | 0.000 | 0.000 | 0.000 | 0.000 | 0.000 | 0.000 | 0.061 | ||
| 2 spectra, MLINQHTLIFDGSTNPAHPK | 0.982 | 0.000 | 0.000 | 0.000 | 0.000 | 0.000 | 0.000 | 0.018 | ||
| 4 spectra, TLSQFTDALVTIR | 0.966 | 0.000 | 0.000 | 0.000 | 0.000 | 0.000 | 0.000 | 0.034 |
| Plot | Mito | Lyso or Perox | ER | Golgi | PM | Cytosol | Nucleus | ||||||
| Expt B |
3 peptides |
4 spectra |
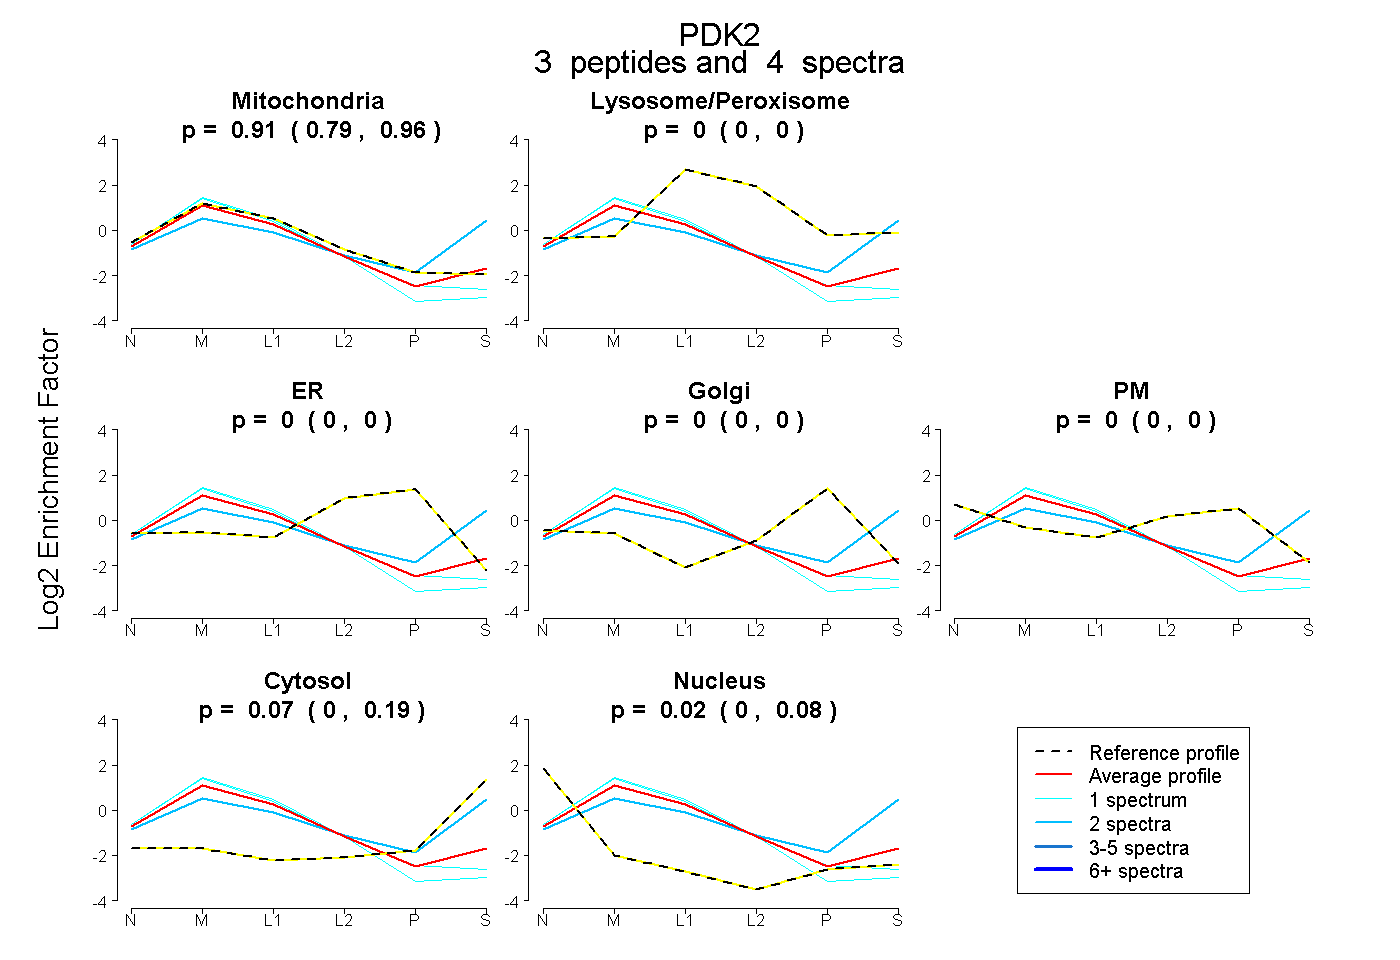 |
0.908 0.788 | 0.957 |
0.000 0.000 | 0.000 |
0.000 0.000 | 0.000 |
0.000 0.000 | 0.000 |
0.000 0.000 | 0.000 |
0.070 0.000 | 0.189 |
0.022 0.000 | 0.081 |
|||
| Plot | Lyso | Other | |||||||||||
| Expt C |
9 peptides |
44 spectra |
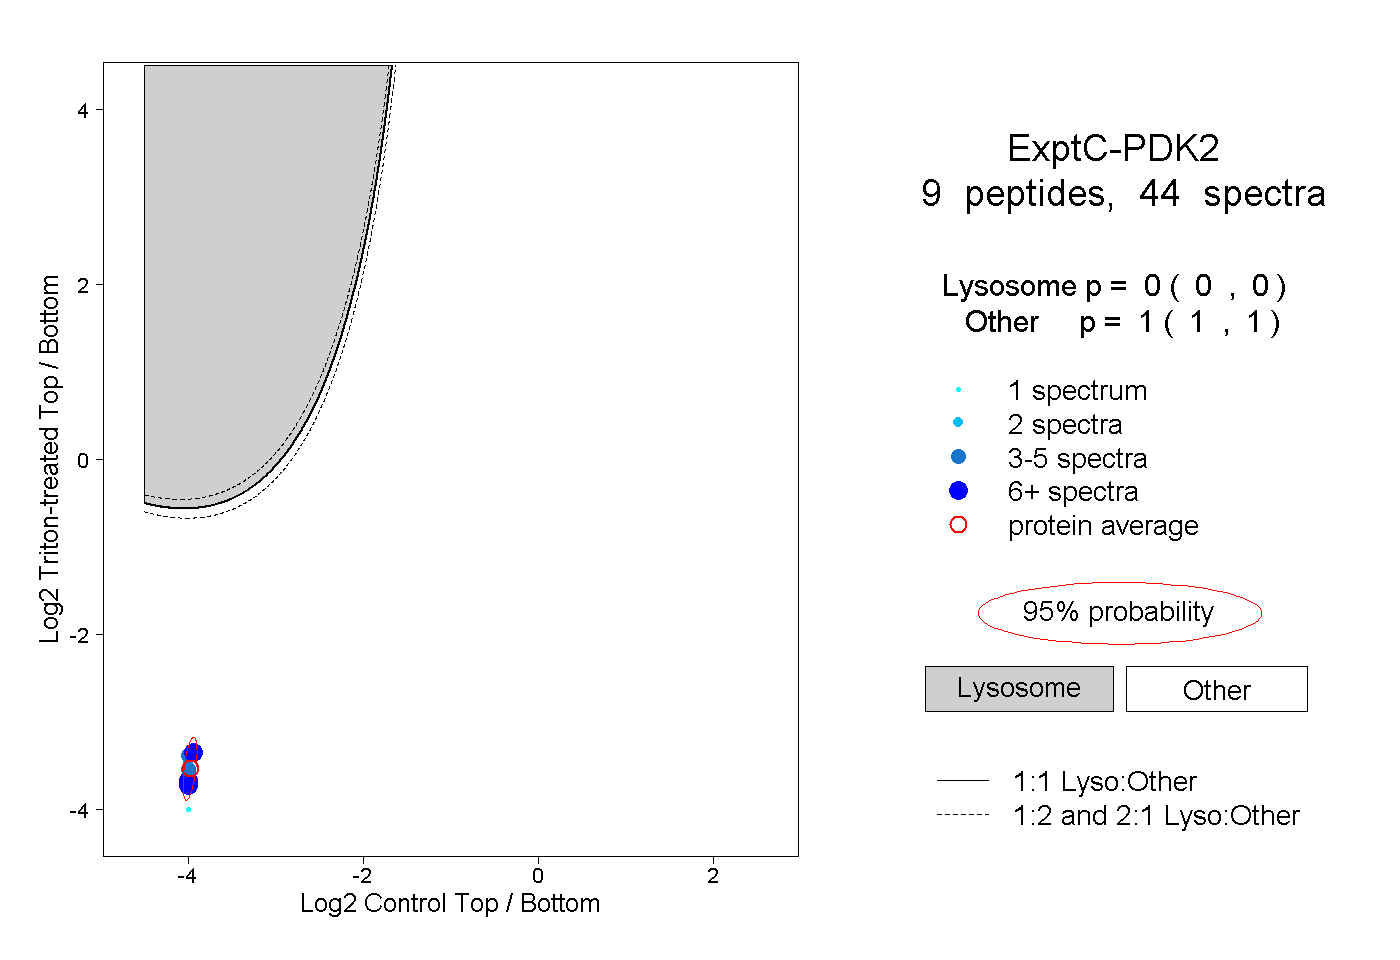 |
0.000 0.000 | 0.000 |
1.000 1.000 | 1.000 |
||||||||
| Plot | Lyso | Other | |||||||||||
| Expt D |
5 peptides |
12 spectra |
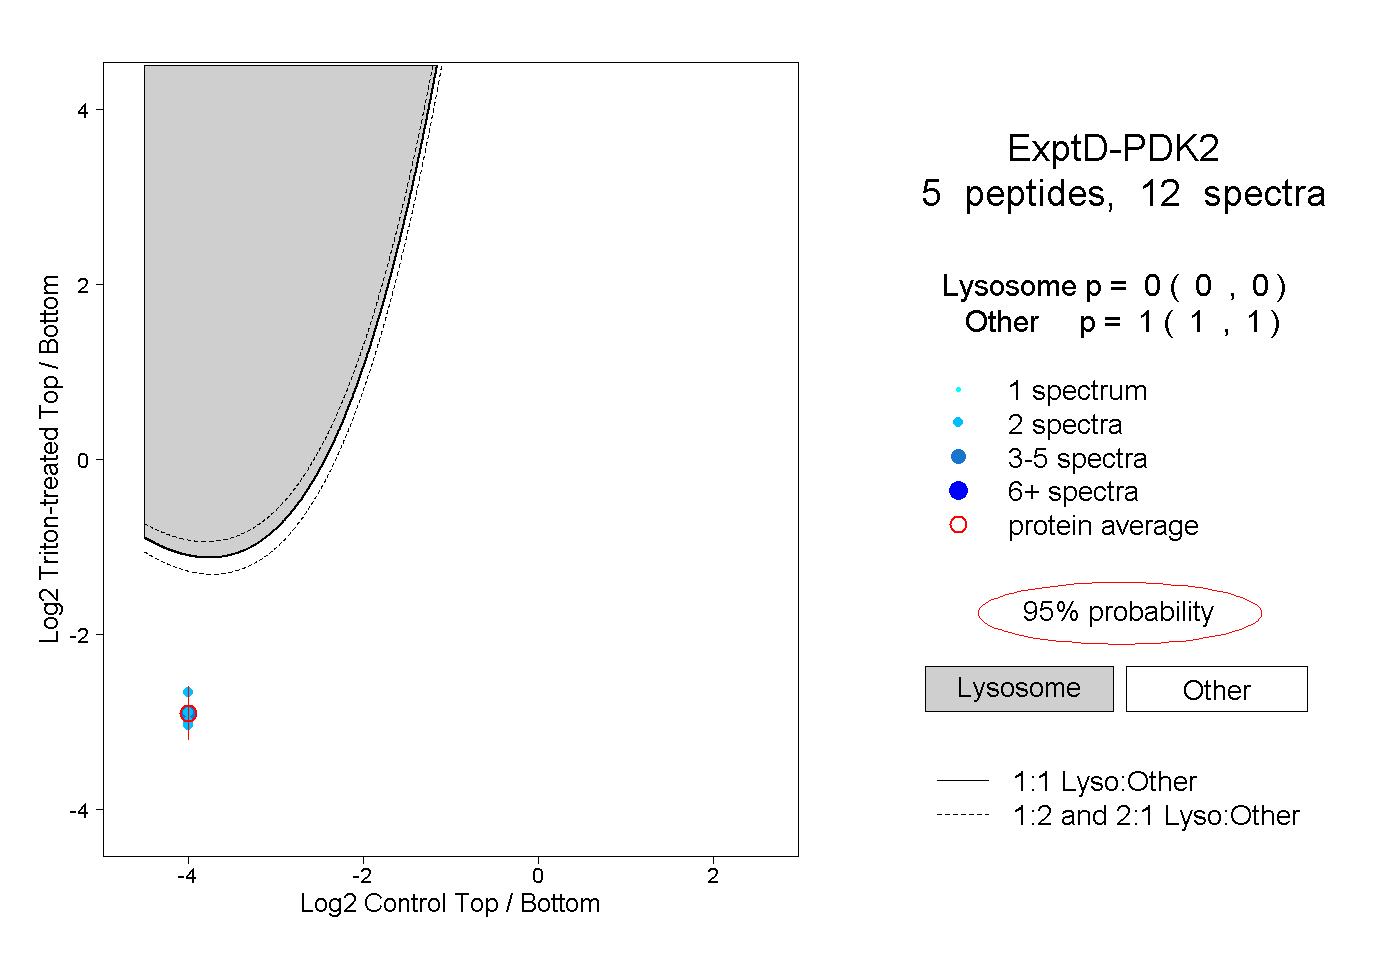 |
0.000 0.000 | 0.000 |
1.000 1.000 | 1.000 |