 3
3peptides
spectra
0.000 | 0.090
0.000 | 0.036
0.000 | 0.174
0.000 | 0.285
0.000 | 0.356
0.347 | 0.727
0.000 | 0.039
0.000 | 0.045
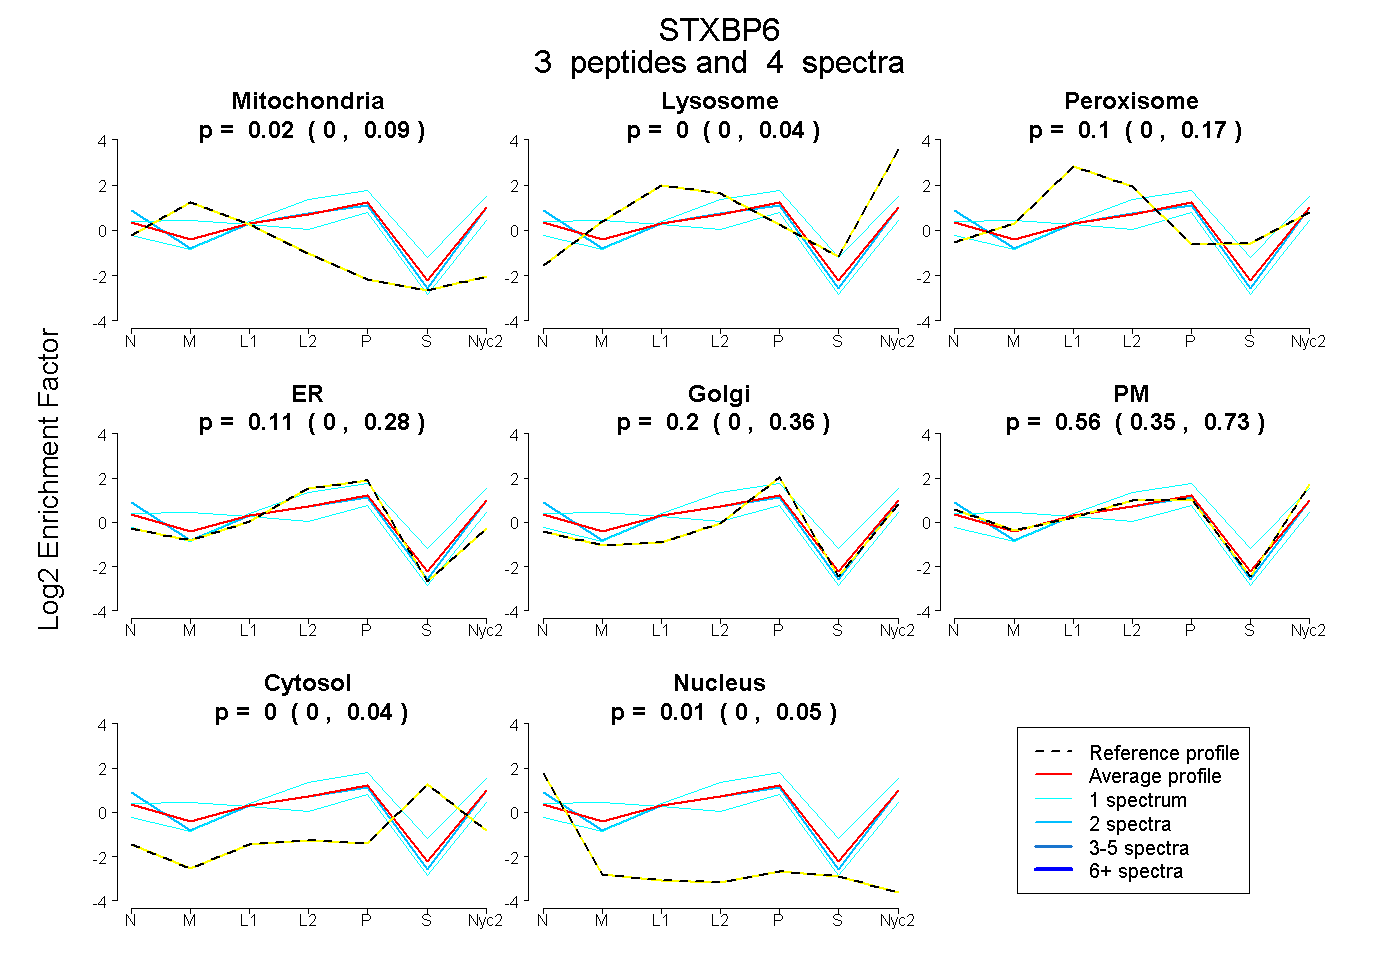
| Plot | Mito | Lyso | Perox | ER | Golgi | PM | Cytosol | Nucleus | |||||
| Expt A |
3 peptides |
4 spectra |
|
0.023 0.000 | 0.090 |
0.000 0.000 | 0.036 |
0.099 0.000 | 0.174 |
0.109 0.000 | 0.285 |
0.202 0.000 | 0.356 |
0.557 0.347 | 0.727 |
0.000 0.000 | 0.039 |
0.010 0.000 | 0.045 |
| 2 spectra, EIFAPLDER | 0.000 | 0.000 | 0.000 | 0.145 | 0.000 | 0.792 | 0.000 | 0.063 | ||
| 1 spectrum, NSAQQFAETAHK | 0.000 | 0.295 | 0.000 | 0.319 | 0.183 | 0.151 | 0.052 | 0.000 | ||
| 1 spectrum, MLGAVQVK | 0.269 | 0.000 | 0.000 | 0.024 | 0.145 | 0.562 | 0.000 | 0.000 |
| Plot | Lyso | Other | |||||||||||
| Expt C |
1 peptide |
2 spectra |
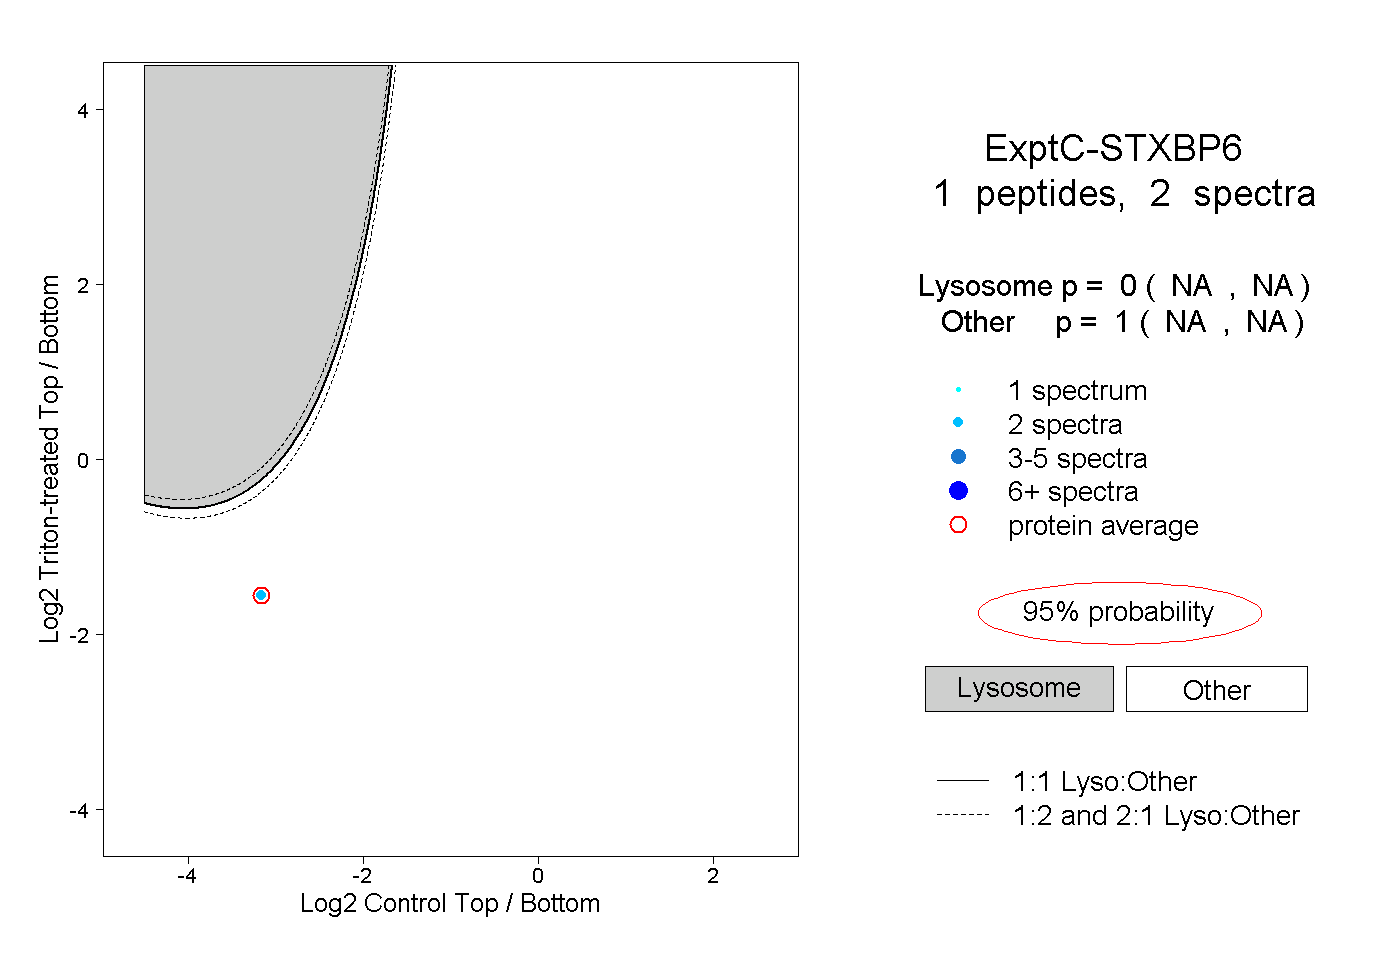 |
0.000 NA | NA |
1.000 NA | NA |