 3
3peptides
spectra
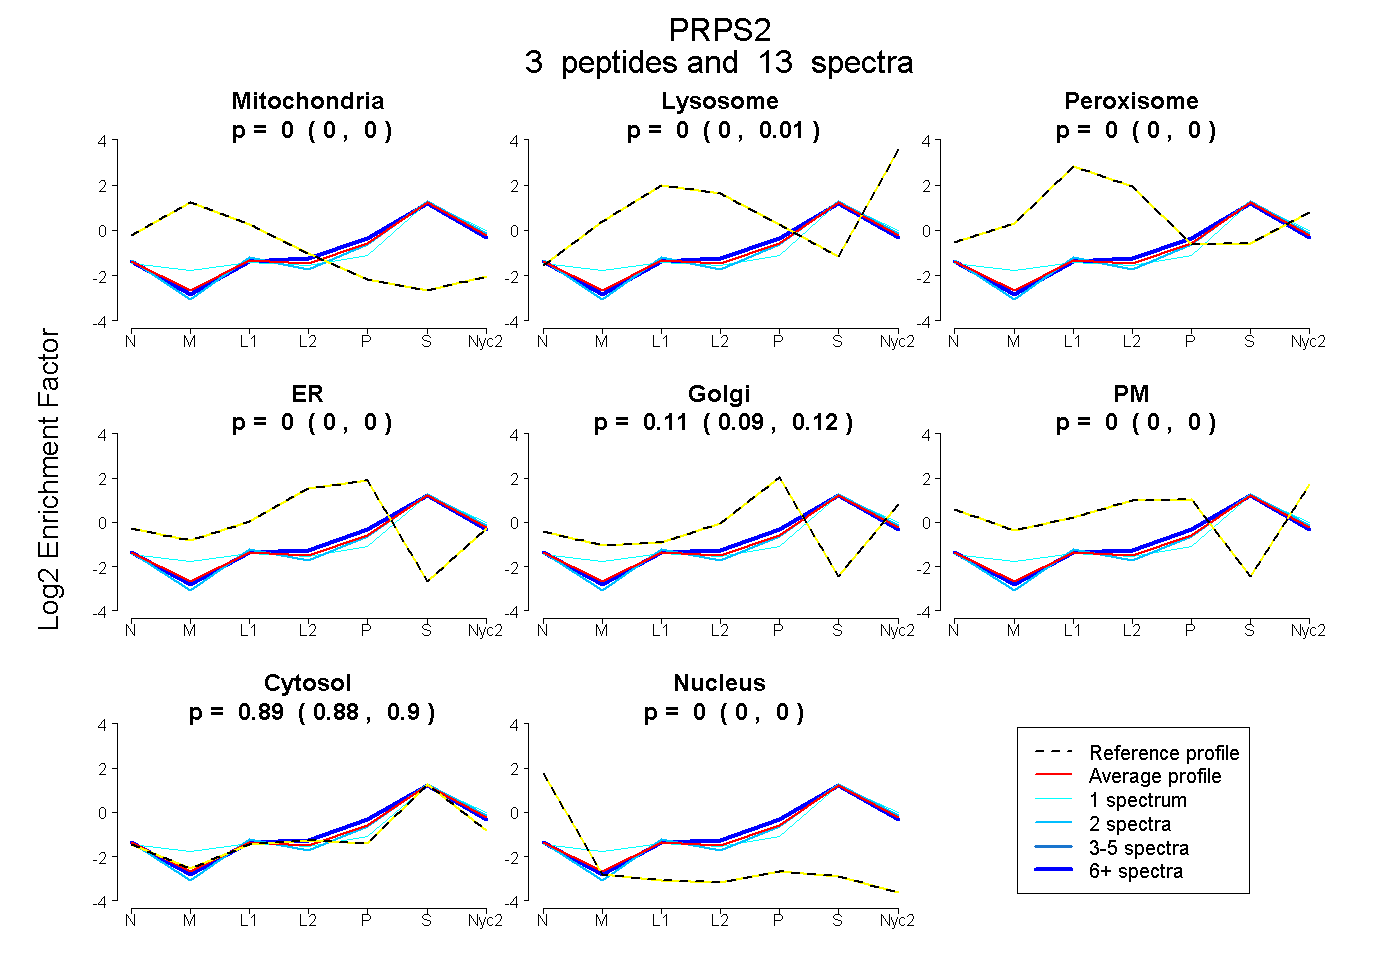
0.000 | 0.000
0.000 | 0.013
0.000 | 0.000
0.000 | 0.000
0.088 | 0.117
0.000 | 0.000
0.878 | 0.904
0.000 | 0.000
1peptide
spectra
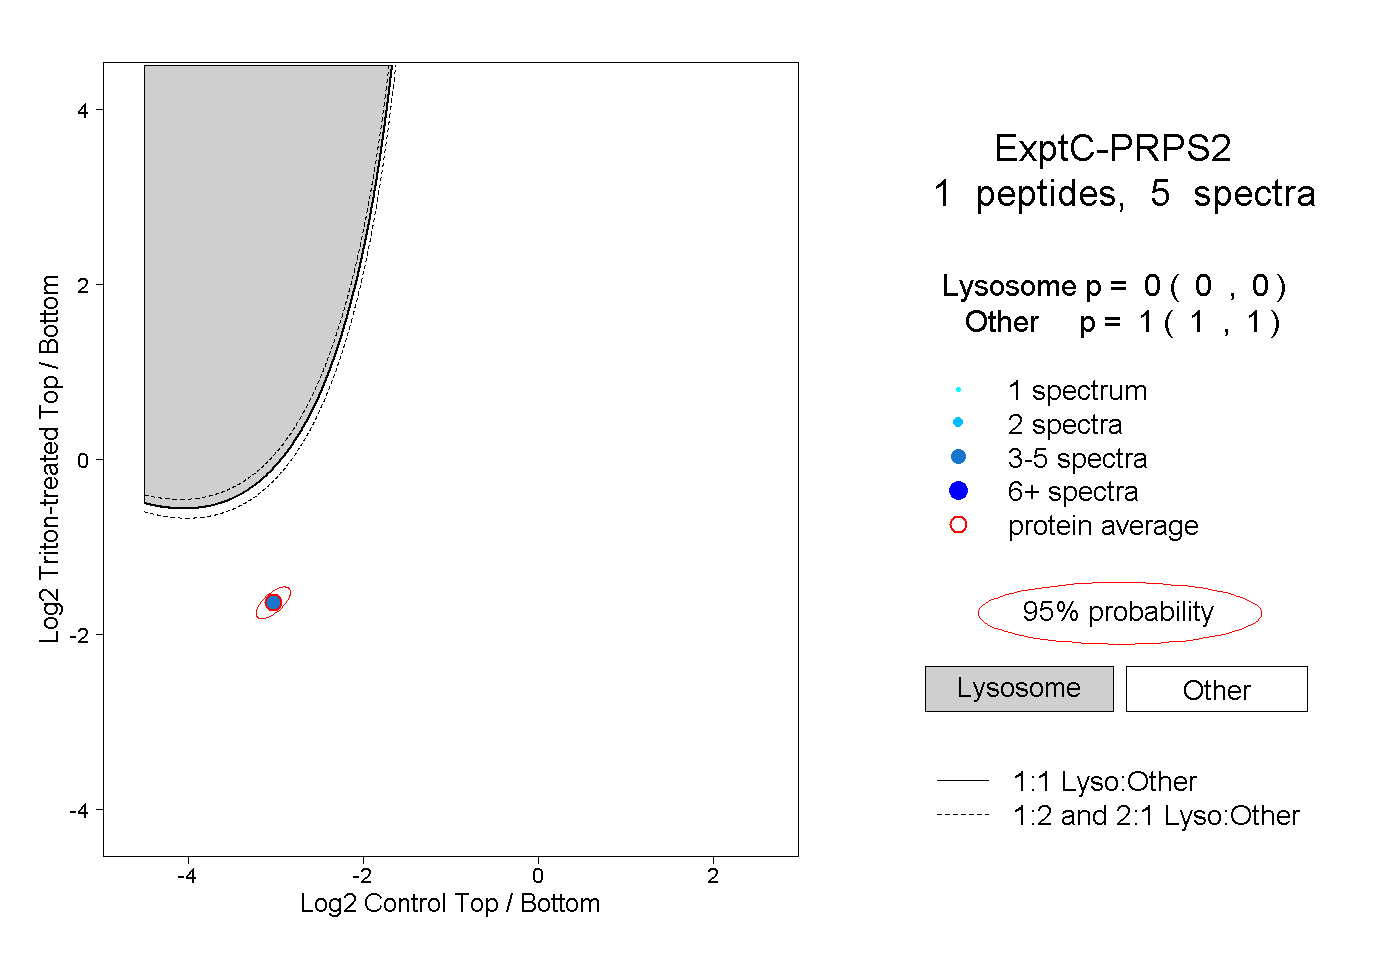
0.000 | 0.000
1.000 | 1.000
| Plot | Mito | Lyso | Perox | ER | Golgi | PM | Cytosol | Nucleus | |||||
| Expt A |
3 peptides |
13 spectra |
|
0.000 0.000 | 0.000 |
0.001 0.000 | 0.013 |
0.000 0.000 | 0.000 |
0.000 0.000 | 0.000 |
0.106 0.088 | 0.117 |
0.000 0.000 | 0.000 |
0.892 0.878 | 0.904 |
0.000 0.000 | 0.000 |
||
| Plot | Lyso | Other | |||||||||||
| Expt C |
1 peptide |
5 spectra |
|
0.000 0.000 | 0.000 |
1.000 1.000 | 1.000 |