13
13peptides
spectra
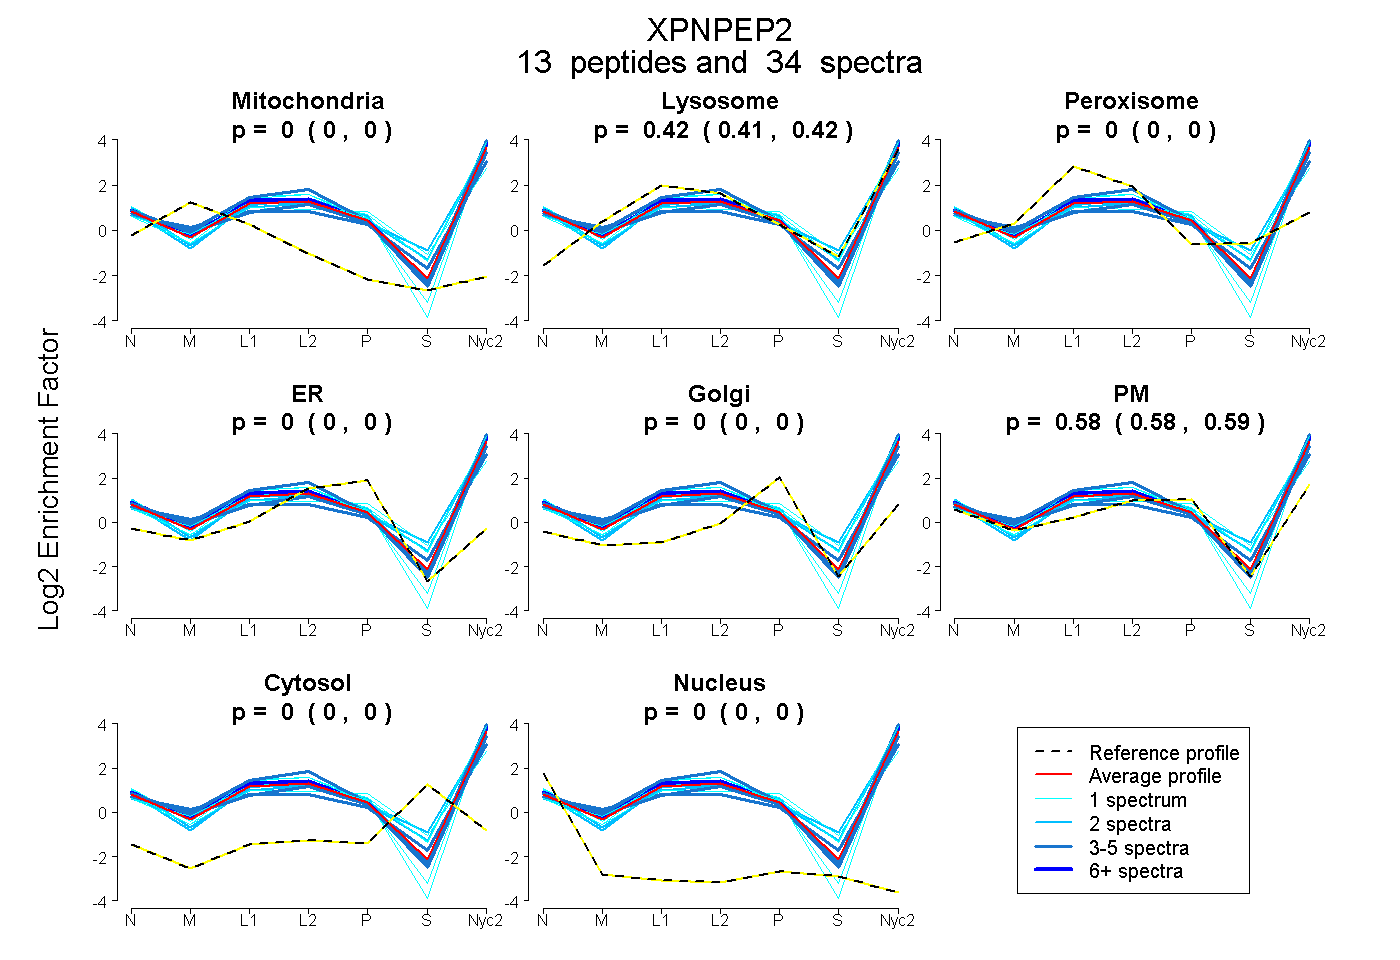
0.000 | 0.000
0.408 | 0.422
0.000 | 0.000
0.000 | 0.000
0.000 | 0.000
0.576 | 0.591
0.000 | 0.000
0.000 | 0.000
5peptides
spectra
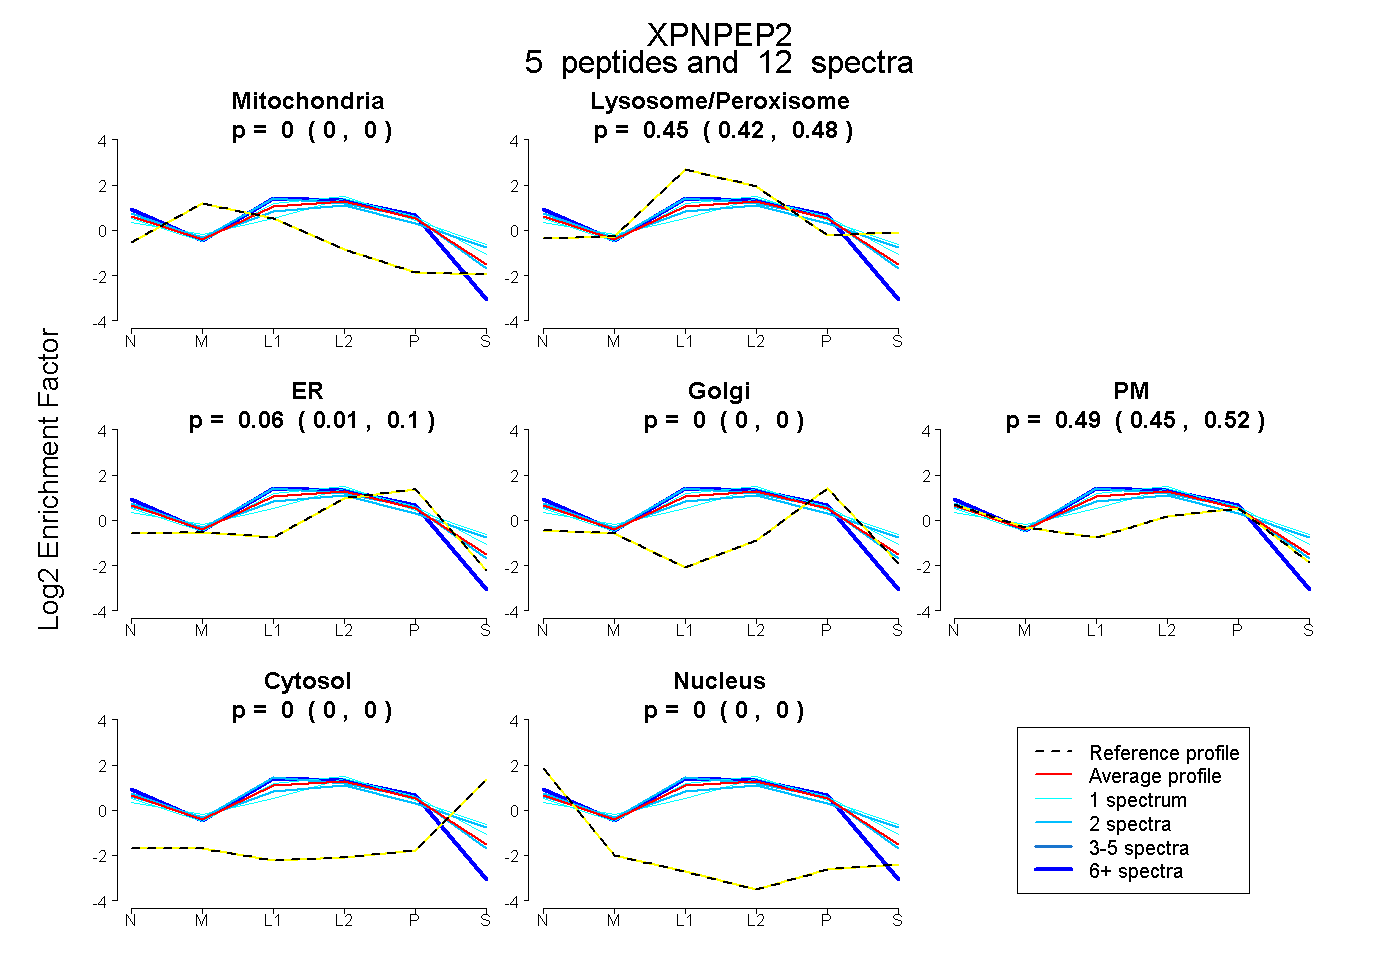
0.000 | 0.000
0.422 | 0.483
0.005 | 0.097
0.000 | 0.000
0.455 | 0.516
0.000 | 0.000
0.000 | 0.000
18peptides
spectra
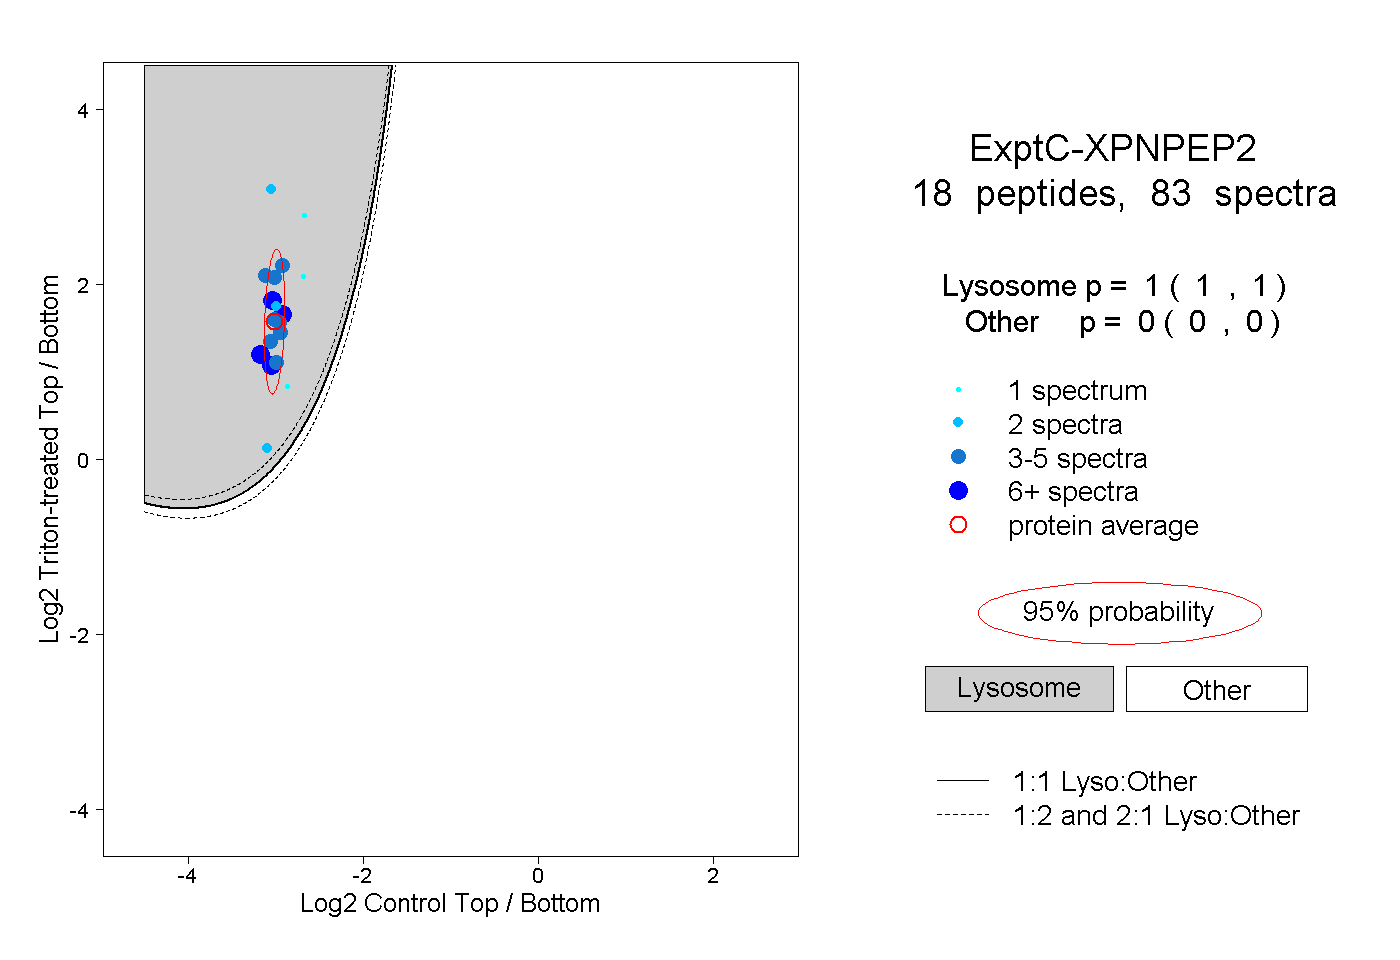
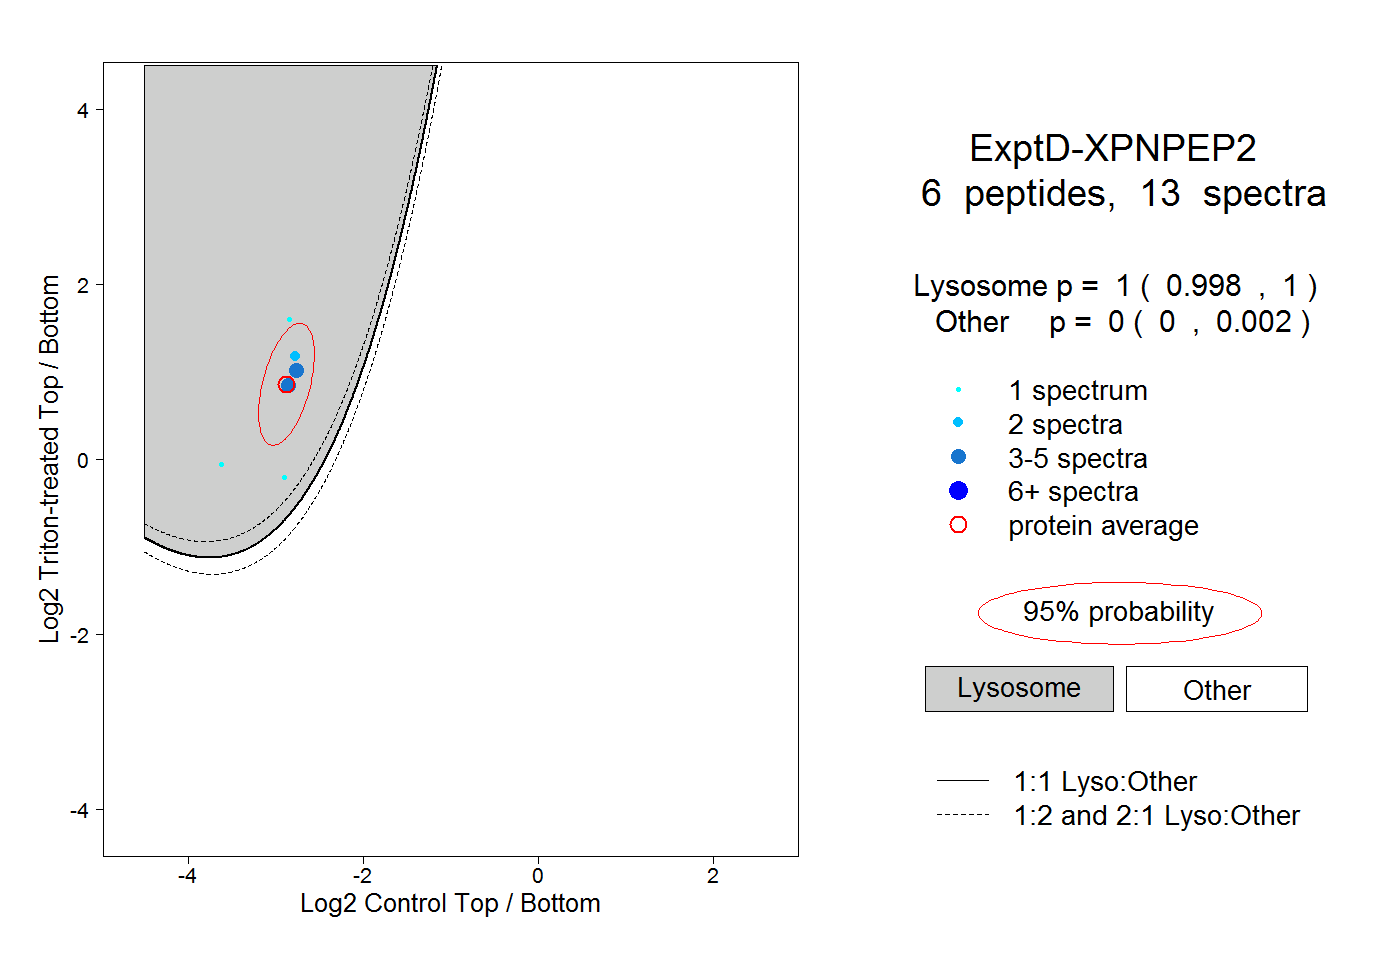
1.000 | 1.000
0.000 | 0.000