 13
13peptides
spectra
0.000 | 0.000
0.408 | 0.422
0.000 | 0.000
0.000 | 0.000
0.000 | 0.000
0.576 | 0.591
0.000 | 0.000
0.000 | 0.000
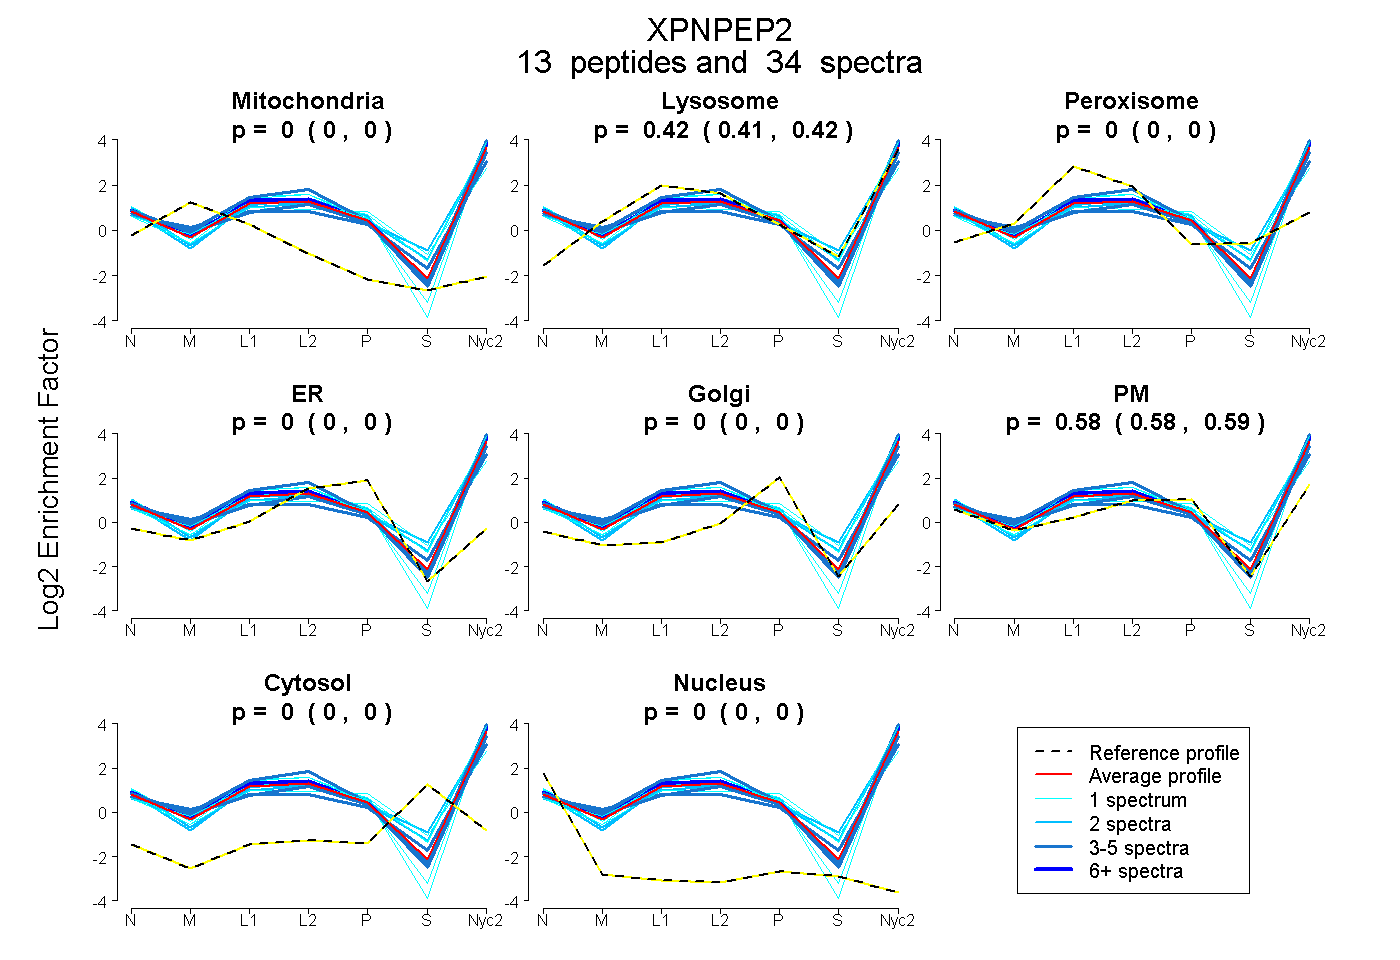
| Plot | Mito | Lyso | Perox | ER | Golgi | PM | Cytosol | Nucleus | |||||
| Expt A |
13 peptides |
34 spectra |
|
0.000 0.000 | 0.000 |
0.416 0.408 | 0.422 |
0.000 0.000 | 0.000 |
0.000 0.000 | 0.000 |
0.000 0.000 | 0.000 |
0.584 0.576 | 0.591 |
0.000 0.000 | 0.000 |
0.000 0.000 | 0.000 |
| 1 spectrum, QLLEEFAWLER | 0.000 | 0.370 | 0.000 | 0.000 | 0.000 | 0.630 | 0.000 | 0.000 | ||
| 3 spectra, ENIGPELQR | 0.000 | 0.438 | 0.000 | 0.000 | 0.000 | 0.562 | 0.000 | 0.000 | ||
| 5 spectra, VLMGNIDLSR | 0.000 | 0.527 | 0.000 | 0.000 | 0.000 | 0.473 | 0.000 | 0.000 | ||
| 7 spectra, LVFPAATSGR | 0.000 | 0.425 | 0.000 | 0.000 | 0.000 | 0.575 | 0.000 | 0.000 | ||
| 1 spectrum, YWTQAER | 0.000 | 0.553 | 0.000 | 0.000 | 0.000 | 0.447 | 0.000 | 0.000 | ||
| 4 spectra, AAVWTDSR | 0.000 | 0.383 | 0.000 | 0.000 | 0.000 | 0.606 | 0.000 | 0.011 | ||
| 2 spectra, EFTGSTWQEK | 0.000 | 0.504 | 0.000 | 0.000 | 0.000 | 0.496 | 0.000 | 0.000 | ||
| 2 spectra, DCSTNPPR | 0.000 | 0.315 | 0.000 | 0.000 | 0.000 | 0.685 | 0.000 | 0.000 | ||
| 1 spectrum, EQALLK | 0.000 | 0.528 | 0.000 | 0.000 | 0.000 | 0.472 | 0.000 | 0.000 | ||
| 1 spectrum, LEDVALVVEAK | 0.000 | 0.298 | 0.000 | 0.000 | 0.000 | 0.702 | 0.000 | 0.000 | ||
| 4 spectra, VVEAFAR | 0.000 | 0.307 | 0.000 | 0.000 | 0.000 | 0.693 | 0.000 | 0.000 | ||
| 1 spectrum, QMDCNWELHK | 0.000 | 0.350 | 0.000 | 0.000 | 0.000 | 0.601 | 0.050 | 0.000 | ||
| 2 spectra, GTVDEFSGAEHIDQLR | 0.000 | 0.481 | 0.000 | 0.000 | 0.000 | 0.494 | 0.025 | 0.000 |
| Plot | Mito | Lyso or Perox | ER | Golgi | PM | Cytosol | Nucleus | ||||||
| Expt B |
5 peptides |
12 spectra |
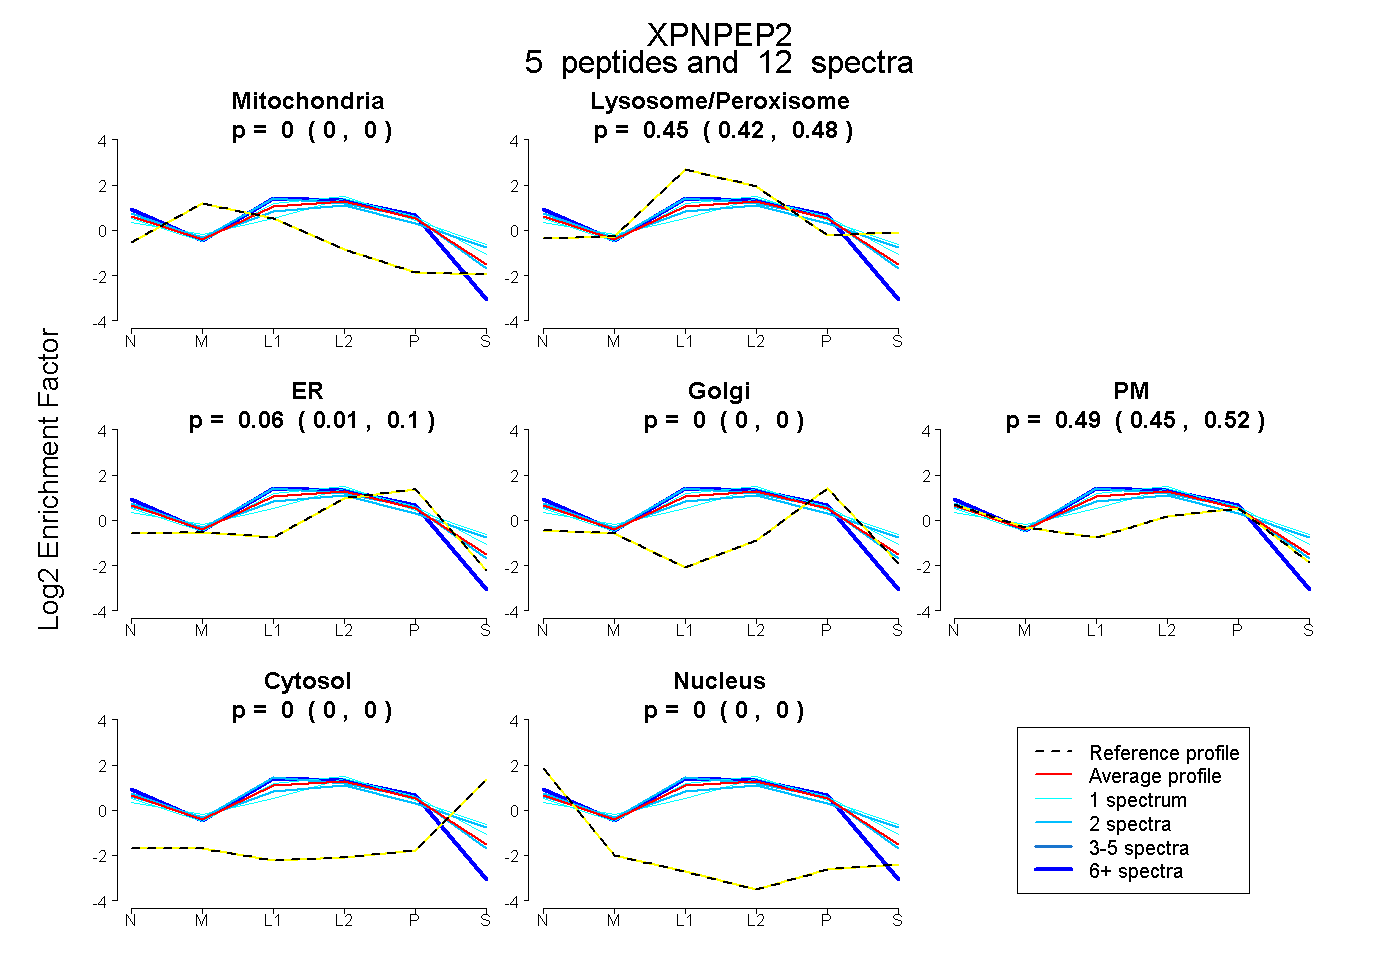 |
0.000 0.000 | 0.000 |
0.454 0.422 | 0.483 |
0.057 0.005 | 0.097 |
0.000 0.000 | 0.000 |
0.489 0.455 | 0.516 |
0.000 0.000 | 0.000 |
0.000 0.000 | 0.000 |
|||
| Plot | Lyso | Other | |||||||||||
| Expt C |
18 peptides |
83 spectra |
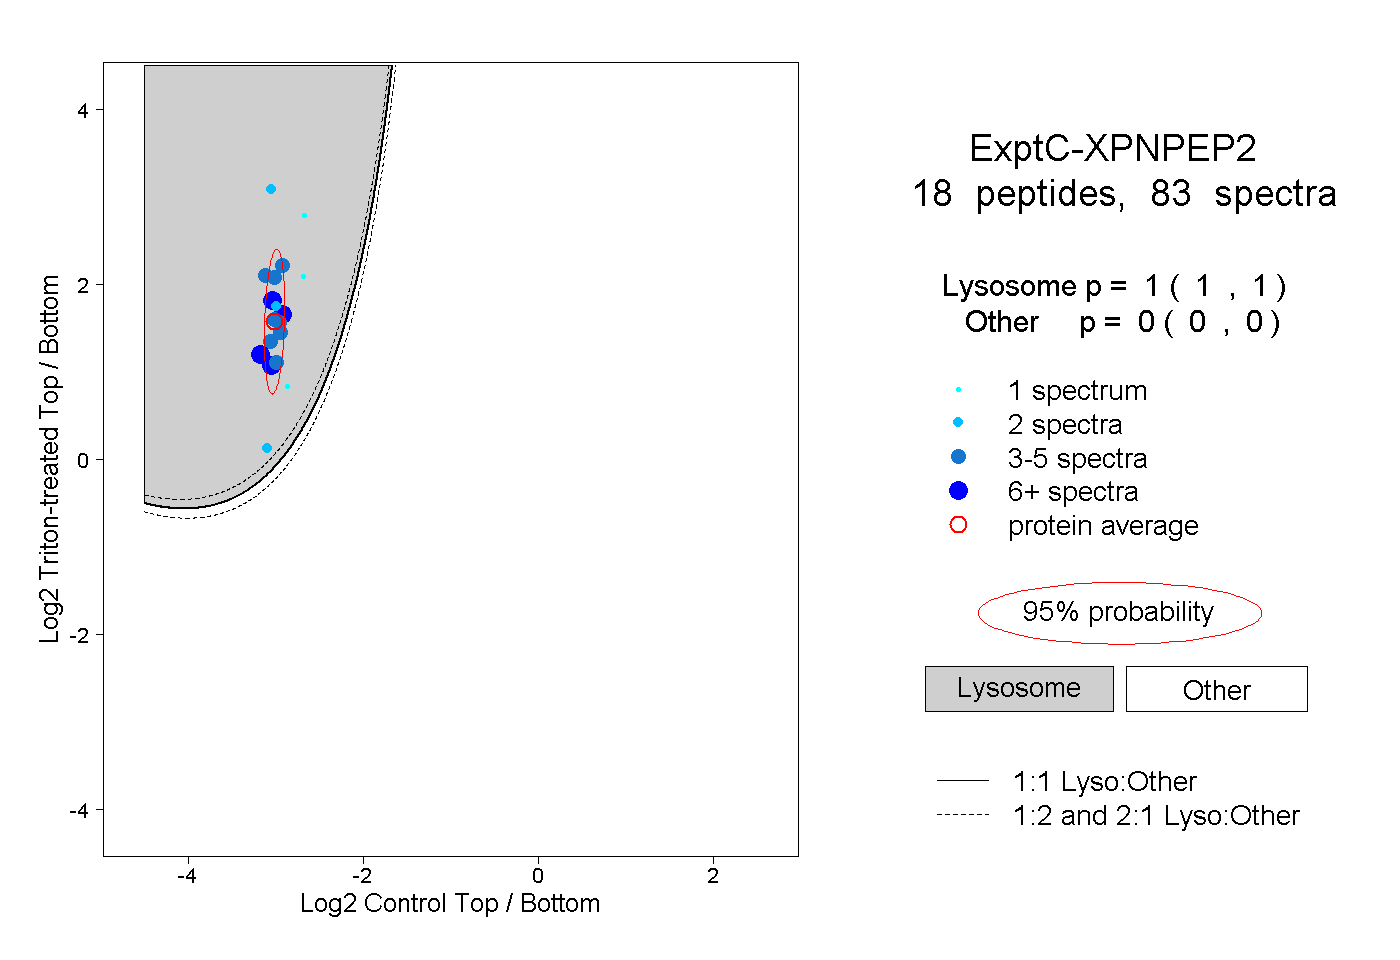 |
1.000 1.000 | 1.000 |
0.000 0.000 | 0.000 |
||||||||
| Plot | Lyso | Other | |||||||||||
| Expt D |
6 peptides |
13 spectra |
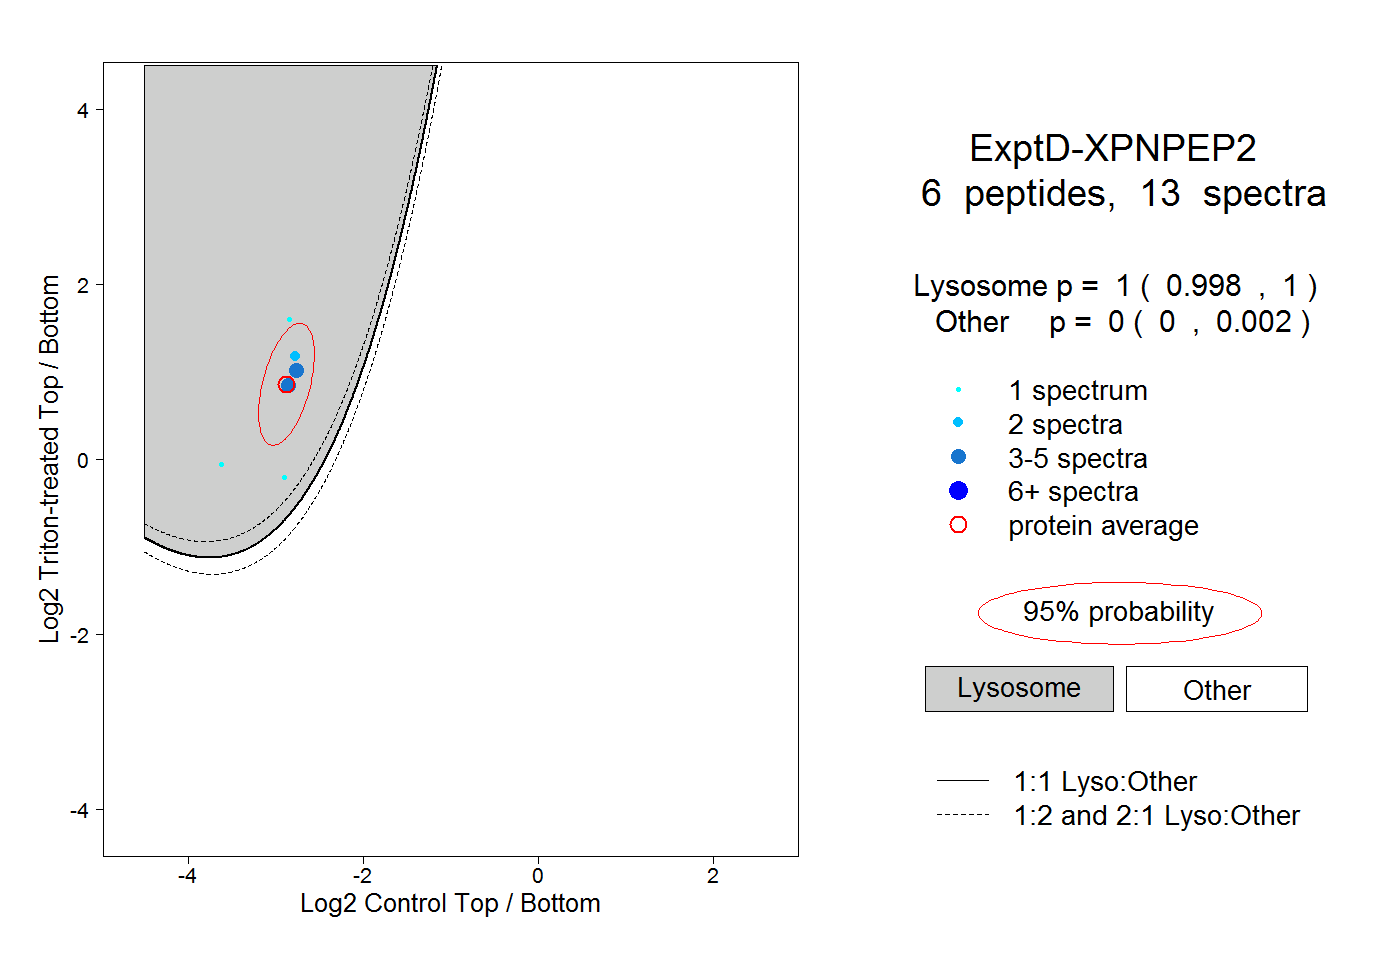 |
1.000 0.998 | 1.000 |
0.000 0.000 | 0.002 |