 3
3peptides
spectra
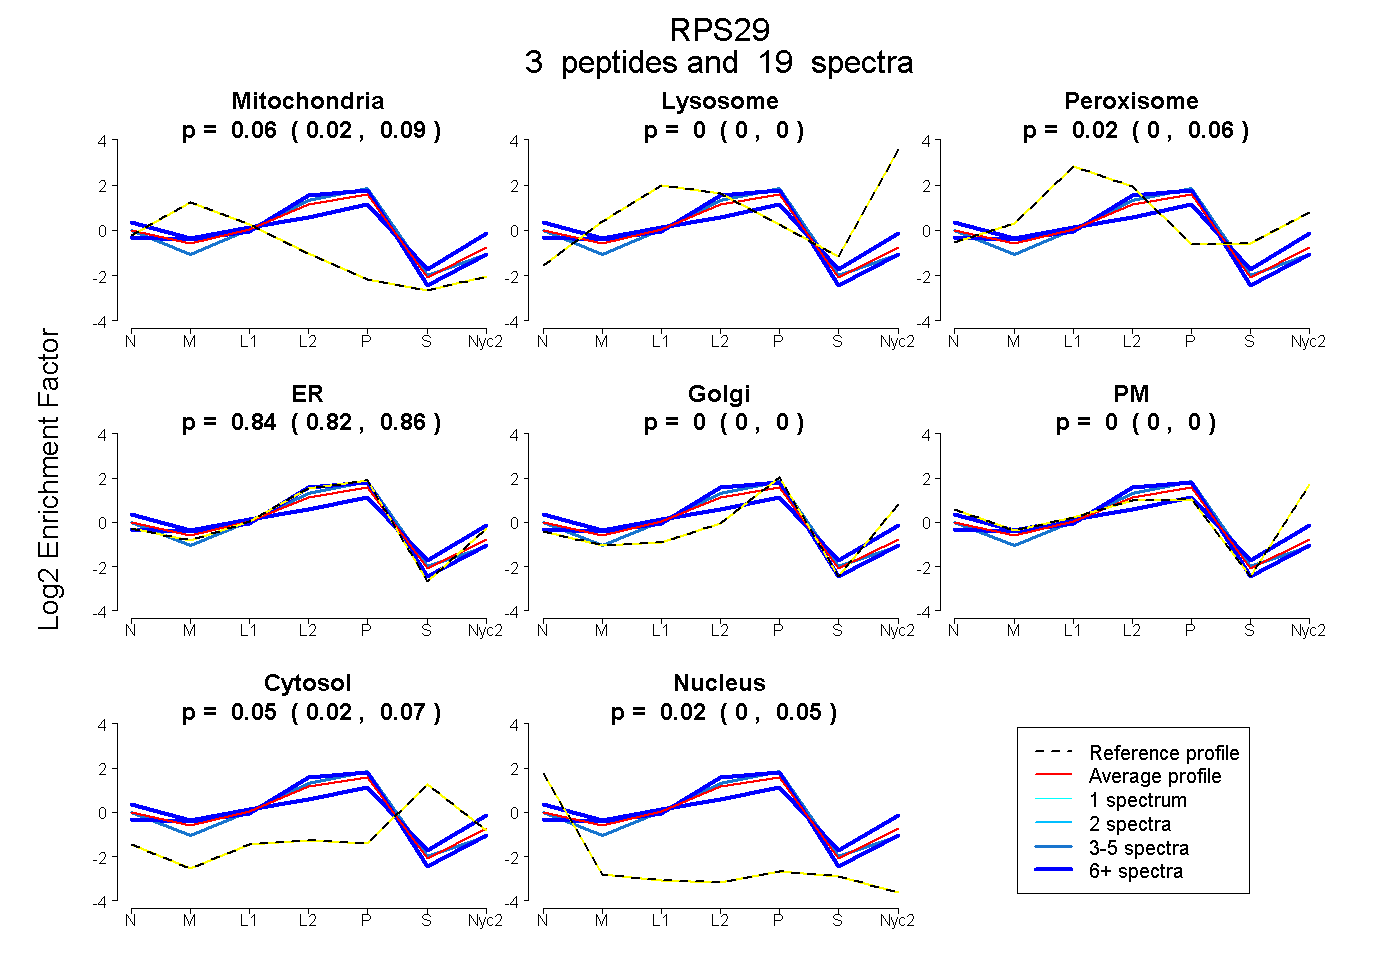
0.024 | 0.090
0.000 | 0.000
0.000 | 0.056
0.816 | 0.865
0.000 | 0.000
0.000 | 0.000
0.020 | 0.066
0.000 | 0.047
1peptide
spectra
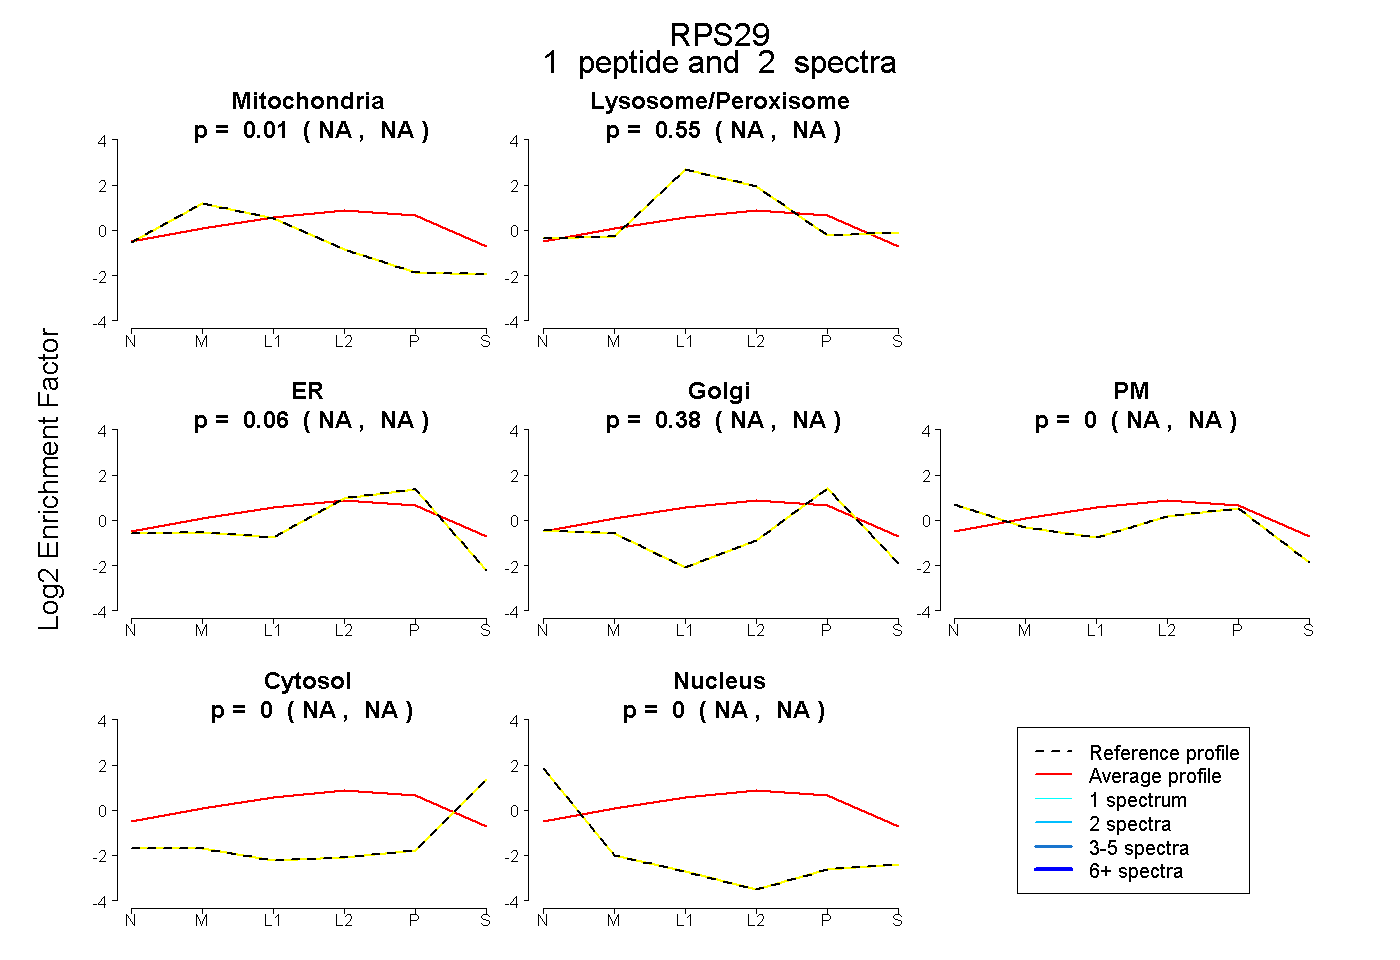
NA | NA
NA | NA
NA | NA
NA | NA
NA | NA
NA | NA
NA | NA
1peptide
spectra
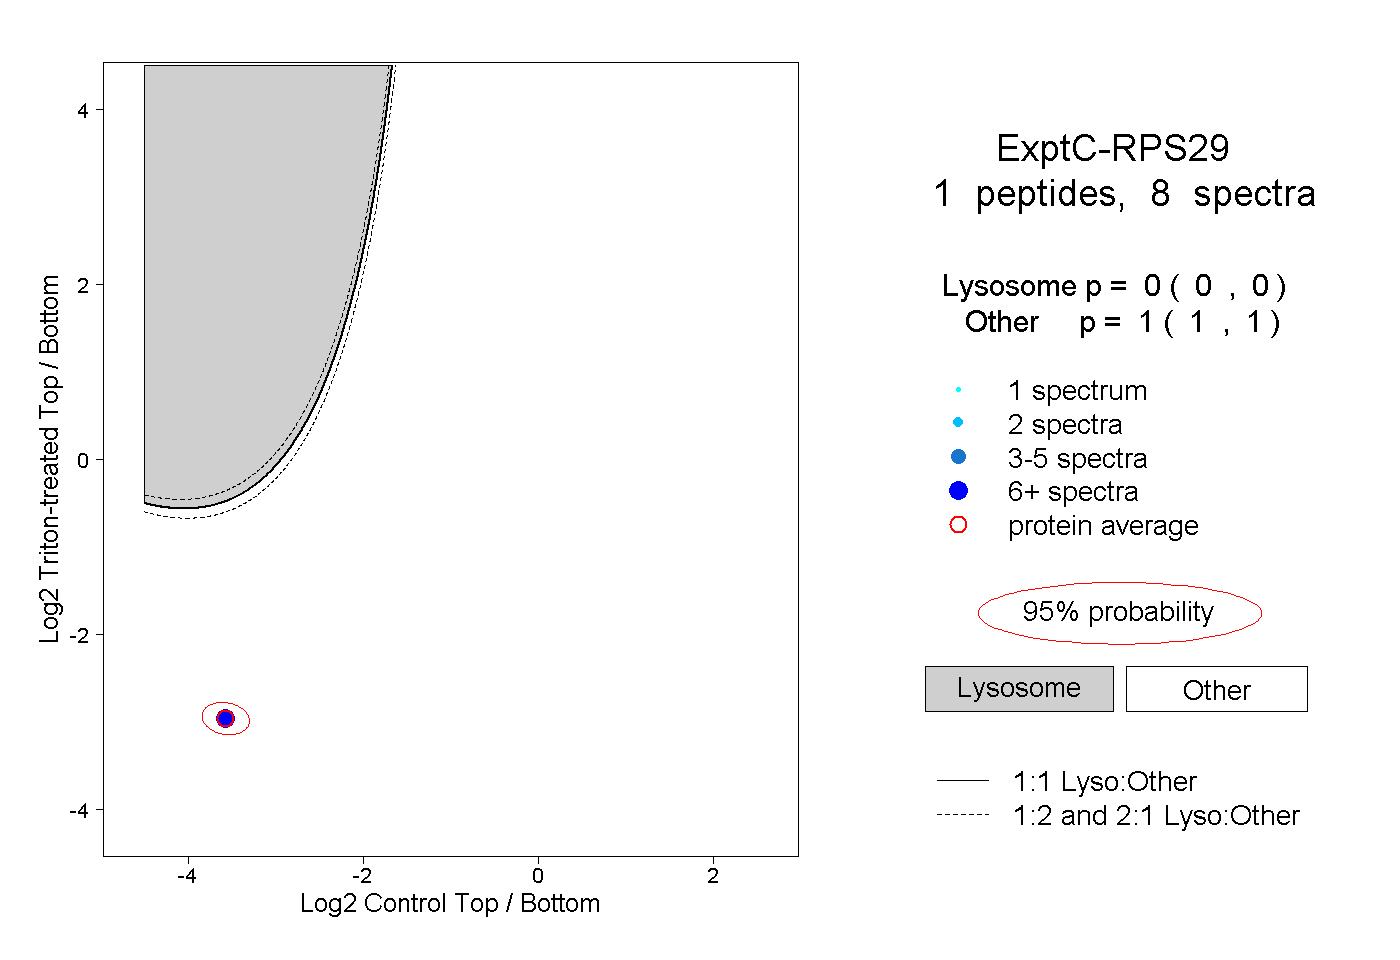
0.000 | 0.000
1.000 | 1.000
1peptide
spectra
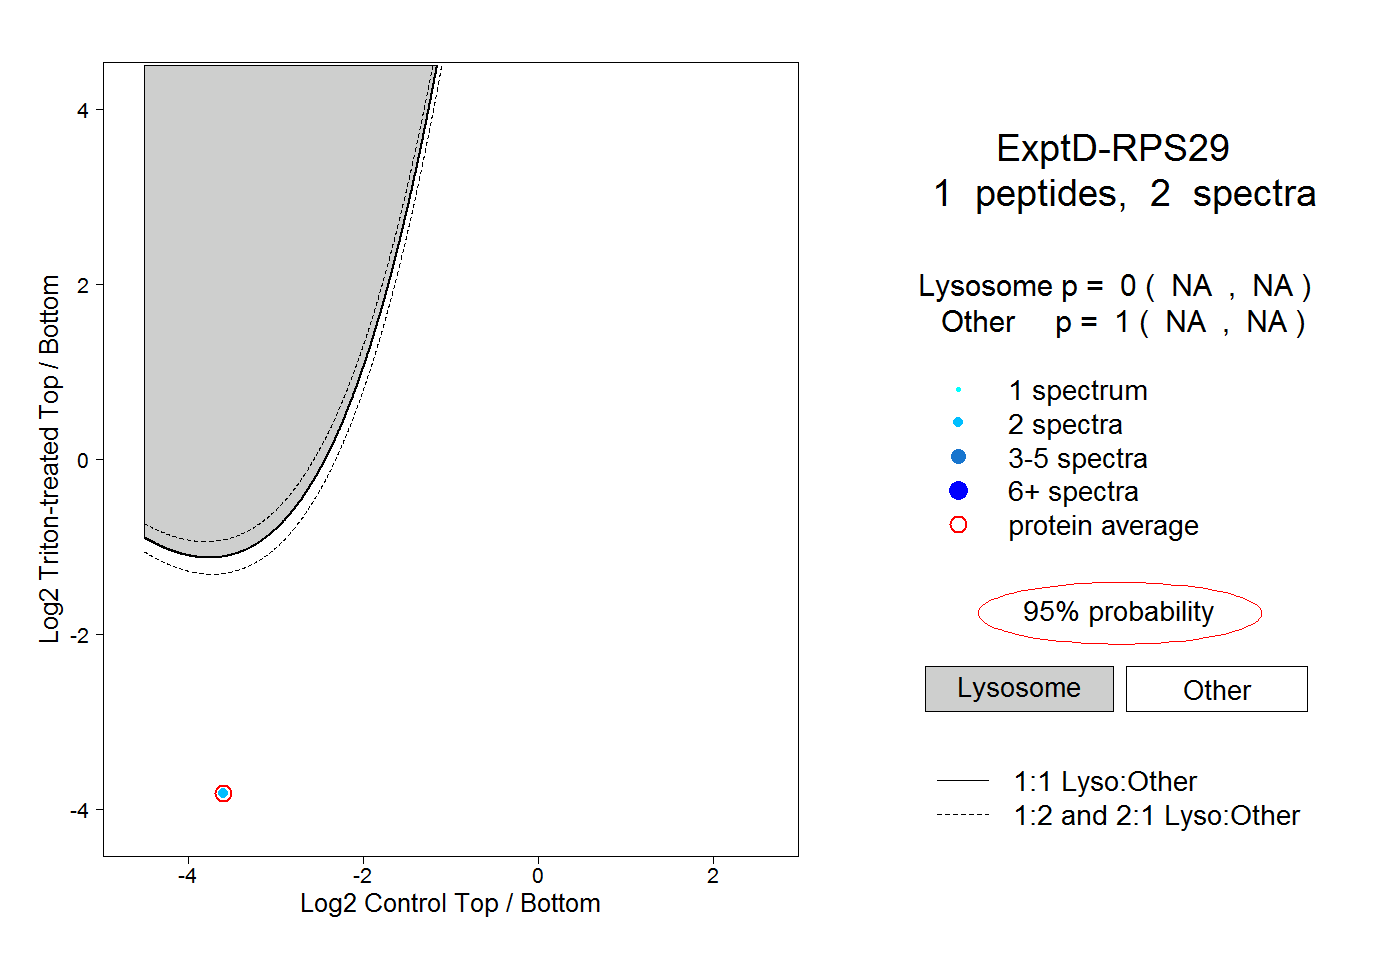
NA | NA
NA | NA