 3
3peptides
spectra
0.000 | 0.489
0.000 | 0.030
0.000 | 0.178
0.000 | 0.326
0.000 | 0.336
0.000 | 0.084
0.026 | 0.530
0.000 | 0.348
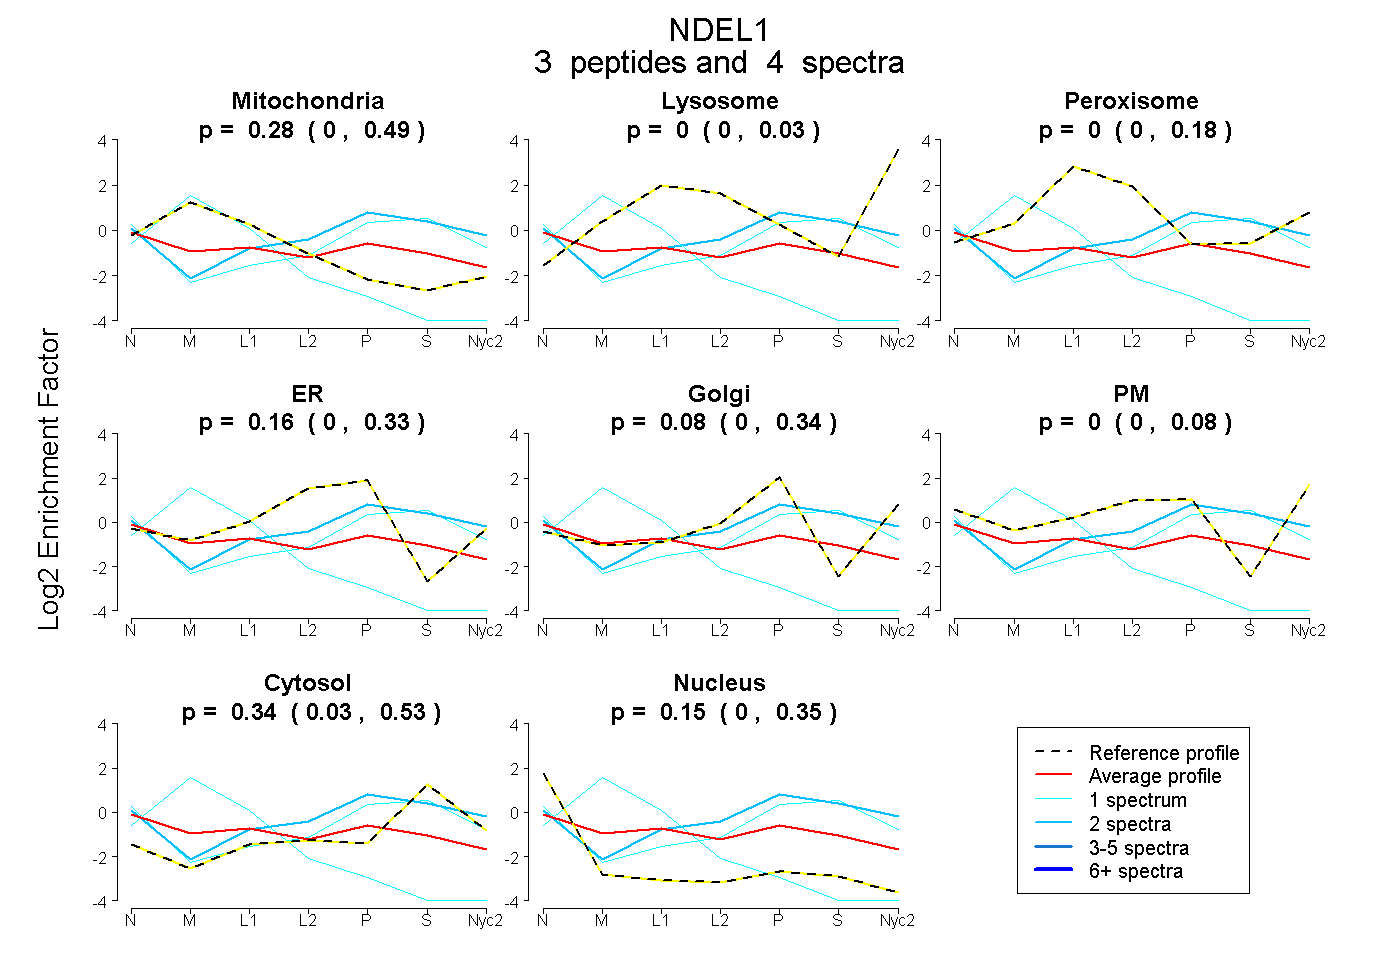
| Plot | Mito | Lyso | Perox | ER | Golgi | PM | Cytosol | Nucleus | |||||
| Expt A |
3 peptides |
4 spectra |
|
0.278 0.000 | 0.489 |
0.000 0.000 | 0.030 |
0.000 0.000 | 0.178 |
0.161 0.000 | 0.326 |
0.078 0.000 | 0.336 |
0.000 0.000 | 0.084 |
0.336 0.026 | 0.530 |
0.147 0.000 | 0.348 |
| 2 spectra, ISALNIVGDLLR | 0.000 | 0.000 | 0.000 | 0.117 | 0.222 | 0.111 | 0.550 | 0.000 | ||
| 1 spectrum, QVSVLEDDLSQTR | 0.881 | 0.000 | 0.000 | 0.000 | 0.000 | 0.000 | 0.000 | 0.119 | ||
| 1 spectrum, ELEQANDDLER | 0.000 | 0.000 | 0.000 | 0.000 | 0.317 | 0.000 | 0.592 | 0.091 |