 2
2peptides
spectra
0.000 | 0.000
0.000 | 0.087
0.000 | 0.185
0.000 | 0.269
0.000 | 0.306
0.008 | 0.285
0.406 | 0.536
0.000 | 0.000
1peptide
spectra
NA | NA
NA | NA
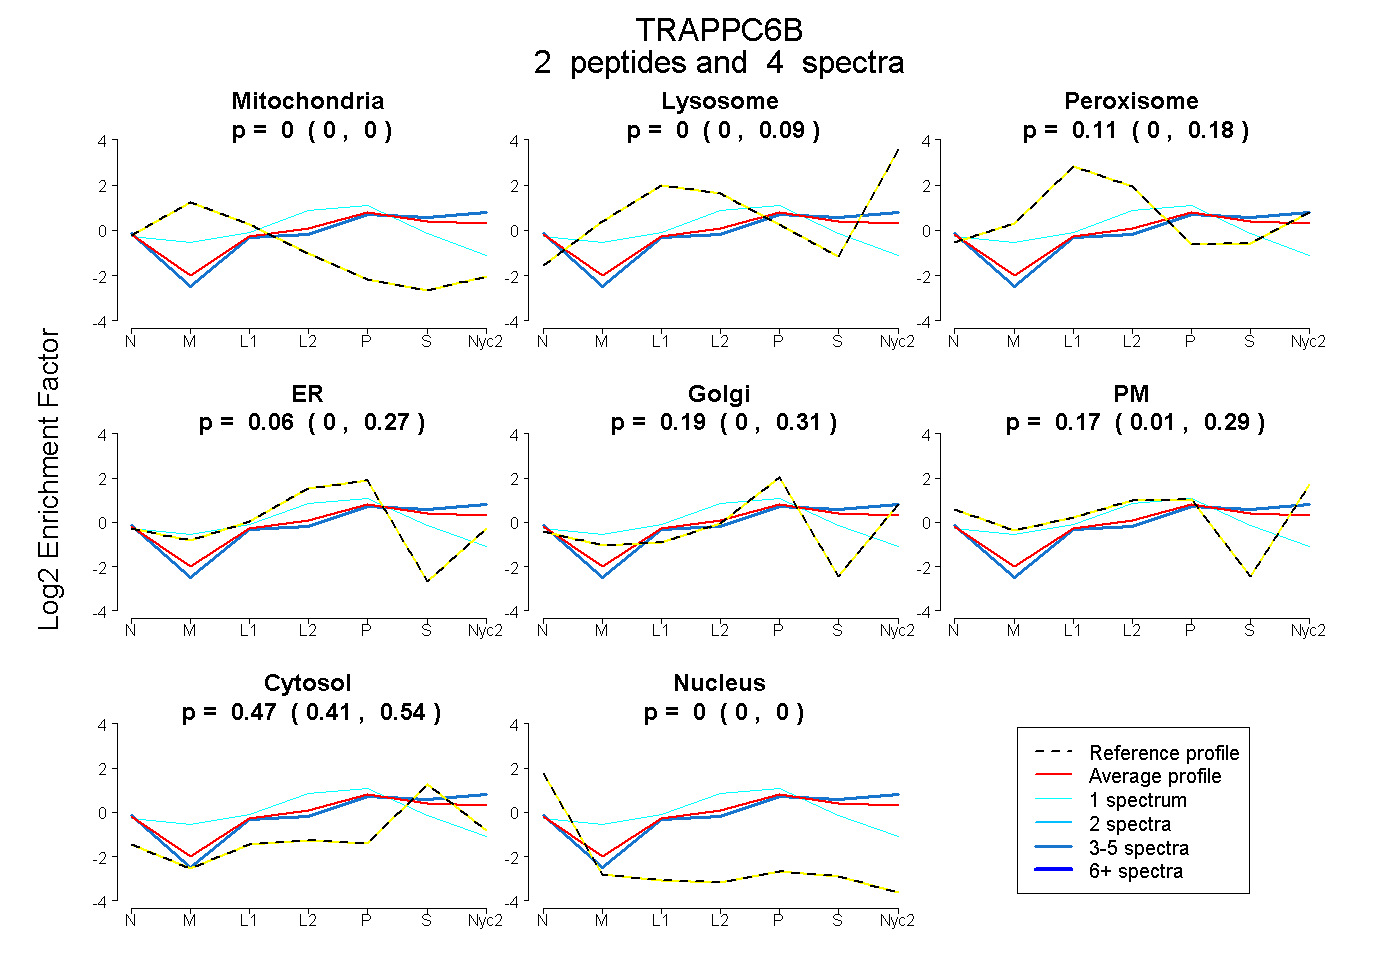
| Plot | Mito | Lyso | Perox | ER | Golgi | PM | Cytosol | Nucleus | |||||
| Expt A |
2 peptides |
4 spectra |
|
0.000 0.000 | 0.000 |
0.000 0.000 | 0.087 |
0.109 0.000 | 0.185 |
0.060 0.000 | 0.269 |
0.190 0.000 | 0.306 |
0.171 0.008 | 0.285 |
0.470 0.406 | 0.536 |
0.000 0.000 | 0.000 |
||
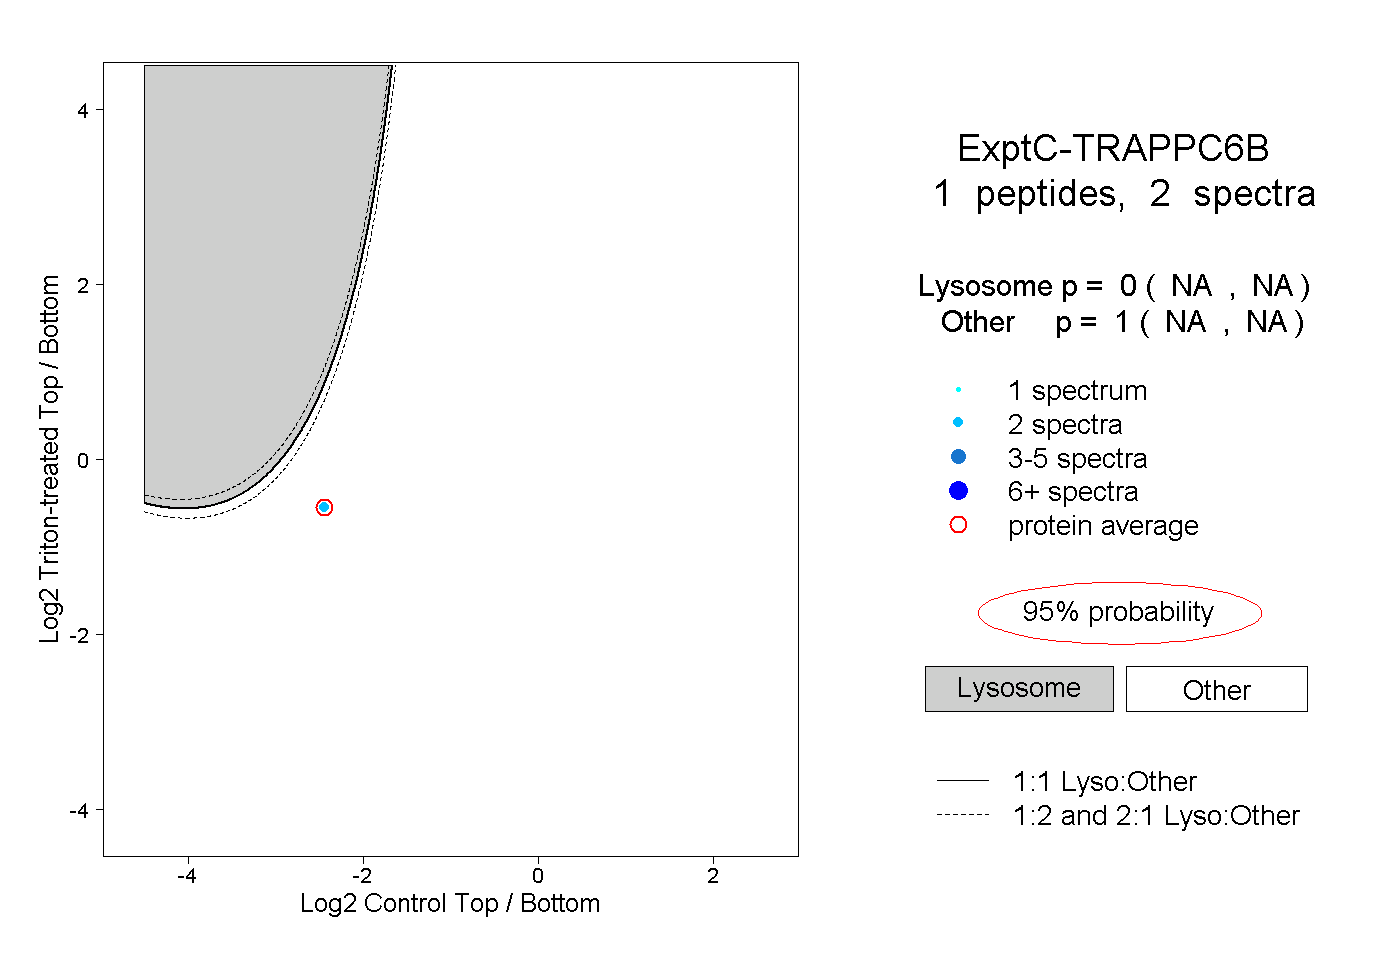
| Plot | Lyso | Other | |||||||||||
| Expt C |
1 peptide |
2 spectra |
|
0.000 NA | NA |
1.000 NA | NA |