 2
2peptides
spectra
0.424 | 0.608
0.000 | 0.000
0.000 | 0.000
0.000 | 0.374
0.000 | 0.000
0.054 | 0.460
0.000 | 0.000
0.000 | 0.007
1peptide
spectra
0.000 | 0.981
0.019 | 1.000
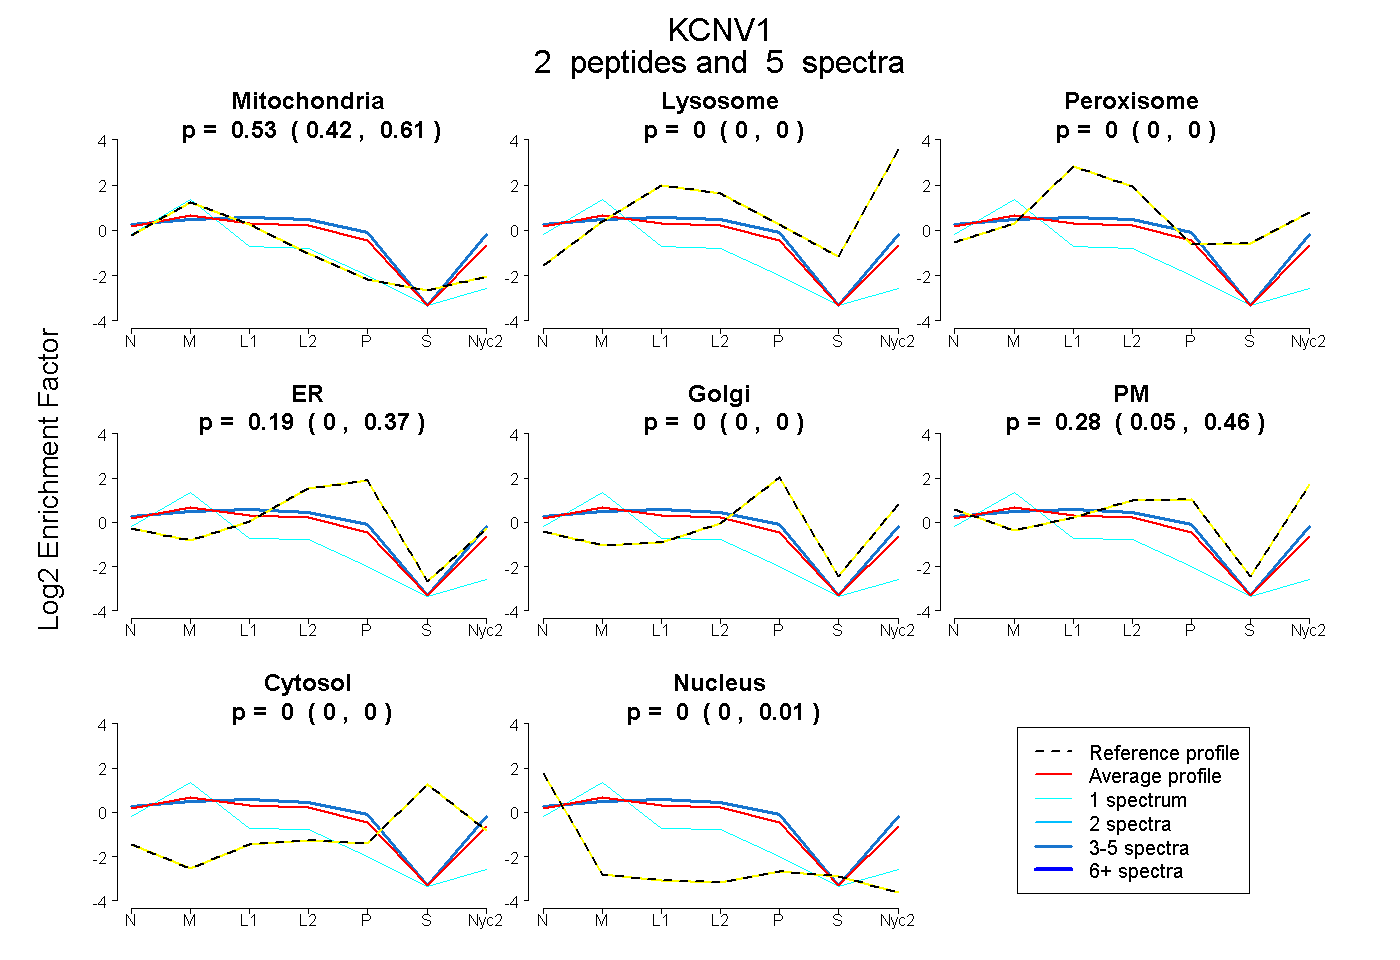
| Plot | Mito | Lyso | Perox | ER | Golgi | PM | Cytosol | Nucleus | |||||
| Expt A |
2 peptides |
5 spectra |
|
0.527 0.424 | 0.608 |
0.000 0.000 | 0.000 |
0.000 0.000 | 0.000 |
0.189 0.000 | 0.374 |
0.000 0.000 | 0.000 |
0.284 0.054 | 0.460 |
0.000 0.000 | 0.000 |
0.000 0.000 | 0.007 |
||
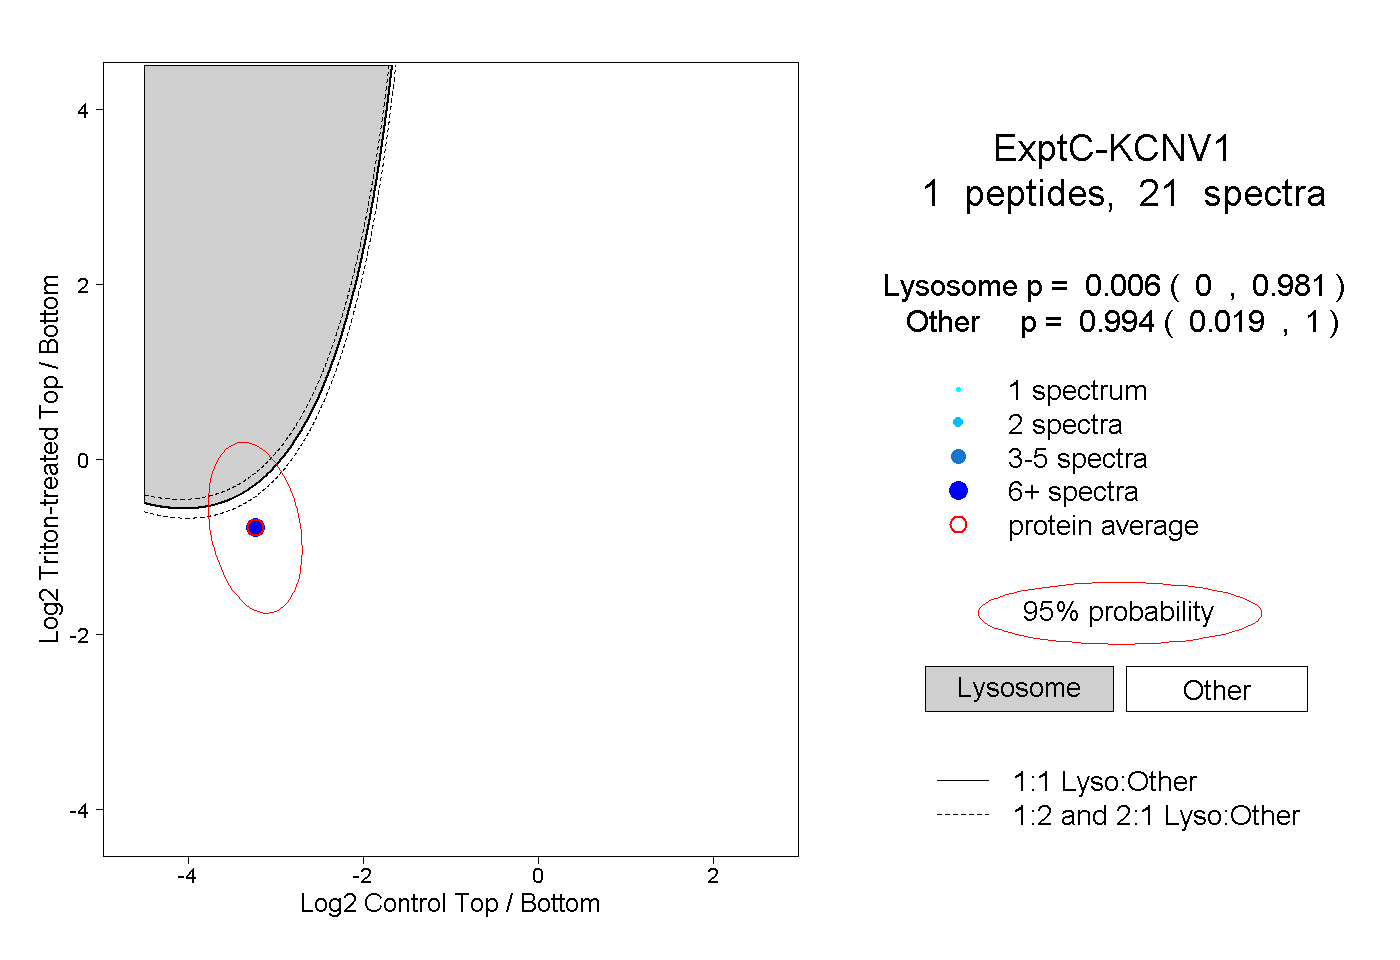
| Plot | Lyso | Other | |||||||||||
| Expt C |
1 peptide |
21 spectra |
|
0.006 0.000 | 0.981 |
0.994 0.019 | 1.000 |