 5
5peptides
spectra
0.000 | 0.000
0.000 | 0.003
0.022 | 0.061
0.000 | 0.000
0.000 | 0.000
0.487 | 0.526
0.434 | 0.459
0.000 | 0.000
1peptide
spectrum
NA | NA
NA | NA
| Plot | Mito | Lyso | Perox | ER | Golgi | PM | Cytosol | Nucleus | |||||
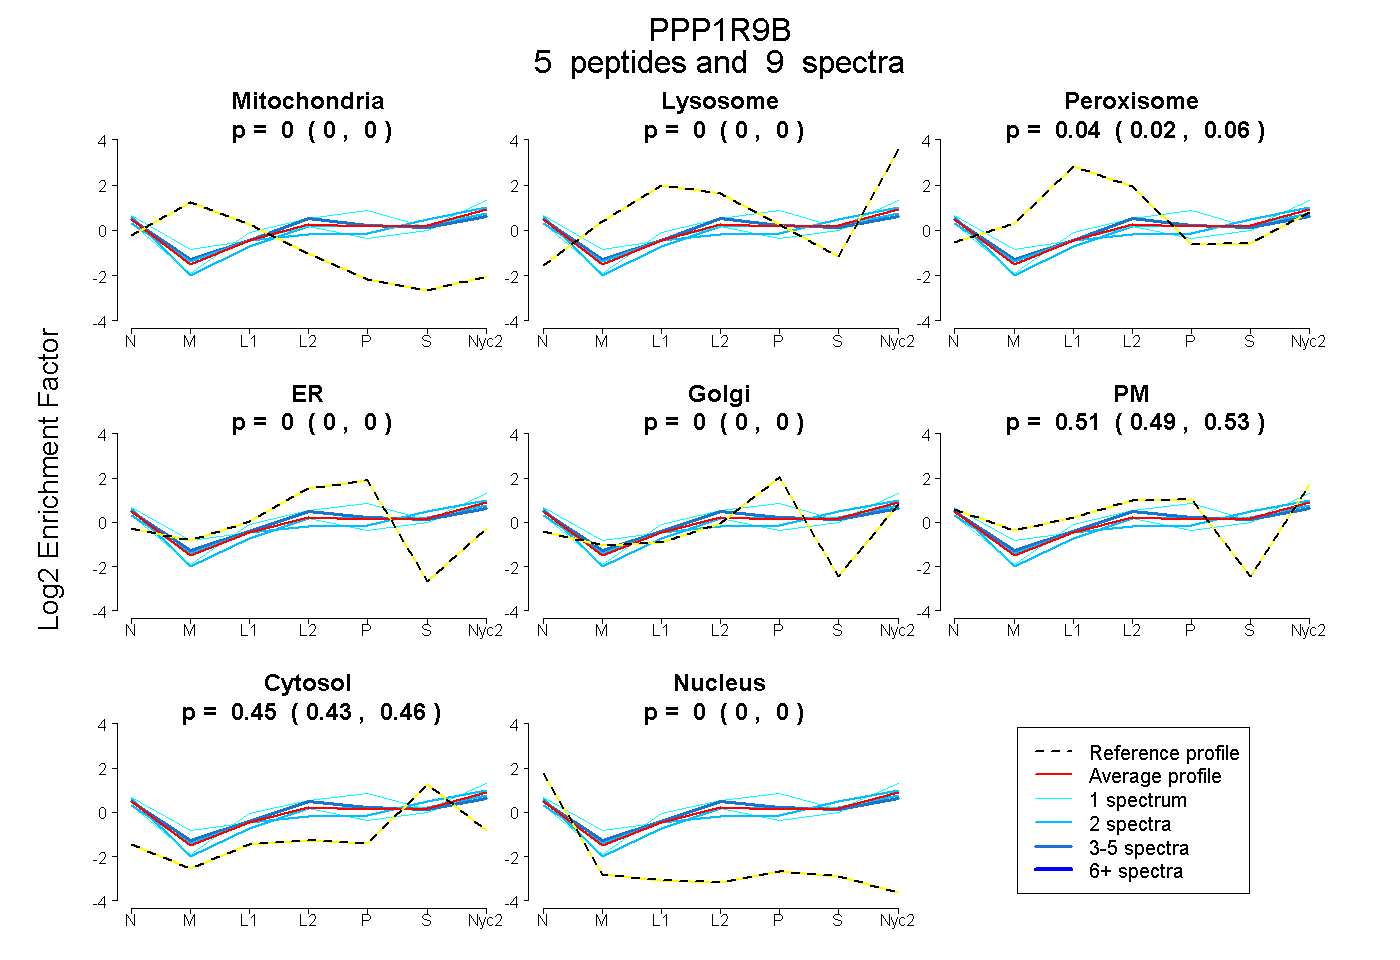
| Expt A |
5 peptides |
9 spectra |
|
0.000 0.000 | 0.000 |
0.000 0.000 | 0.003 |
0.043 0.022 | 0.061 |
0.000 0.000 | 0.000 |
0.000 0.000 | 0.000 |
0.509 0.487 | 0.526 |
0.448 0.434 | 0.459 |
0.000 0.000 | 0.000 |
||
| Plot | Lyso | Other | |||||||||||
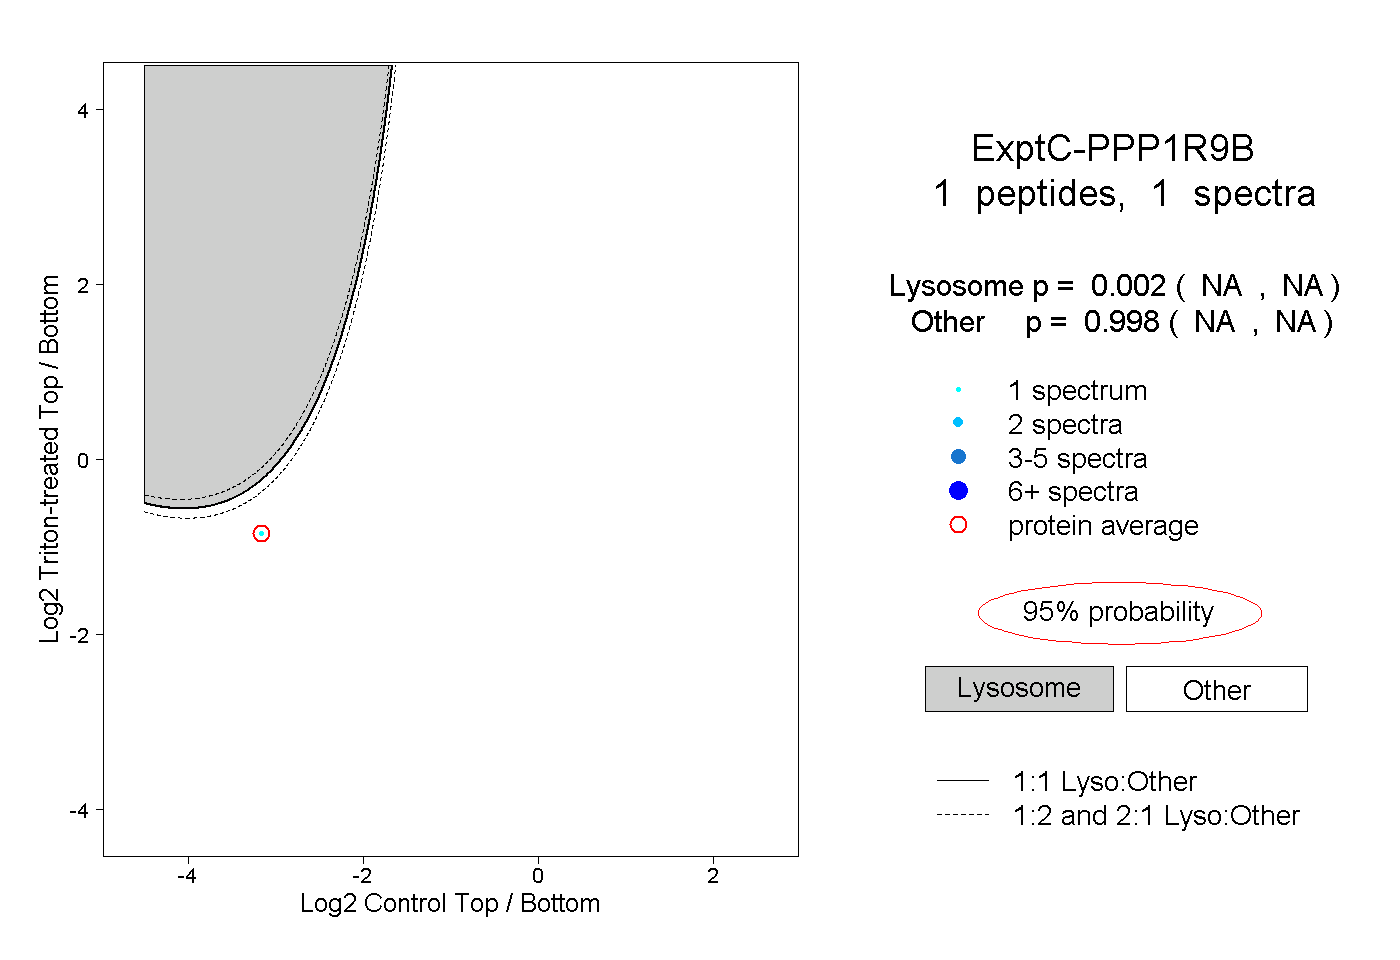
| Expt C |
1 peptide |
1 spectrum |
|
0.002 NA | NA |
0.998 NA | NA |