 23
23peptides
spectra
0.000 | 0.000
0.004 | 0.015
0.000 | 0.000
0.002 | 0.014
0.000 | 0.000
0.973 | 0.989
0.000 | 0.000
0.000 | 0.000
| Plot | Mito | Lyso | Perox | ER | Golgi | PM | Cytosol | Nucleus | |||||
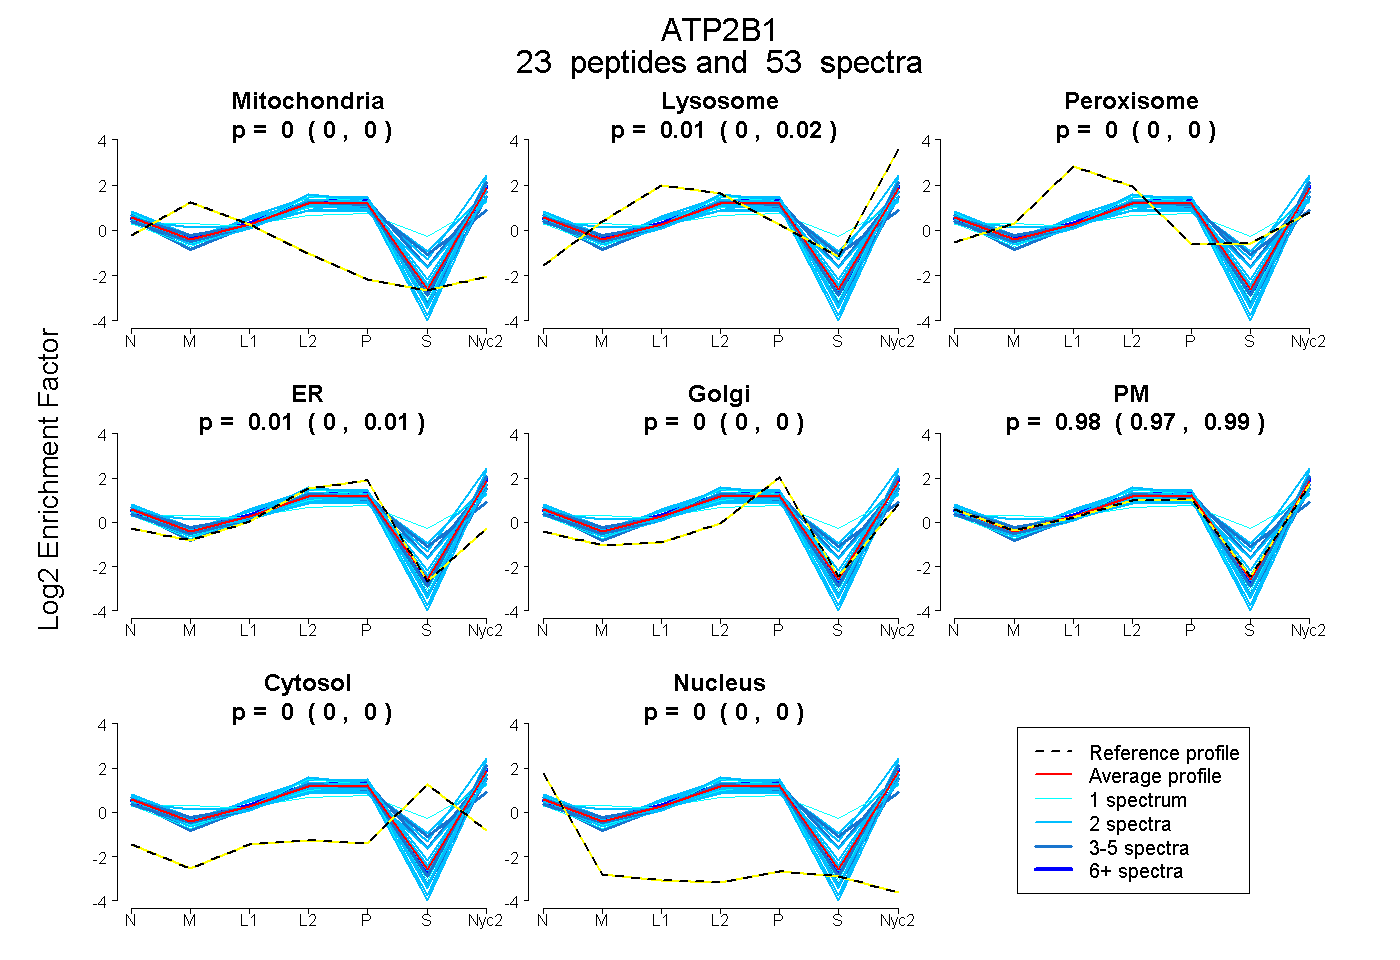
| Expt A |
23 peptides |
53 spectra |
|
0.000 0.000 | 0.000 |
0.010 0.004 | 0.015 |
0.000 0.000 | 0.000 |
0.008 0.002 | 0.014 |
0.000 0.000 | 0.000 |
0.982 0.973 | 0.989 |
0.000 0.000 | 0.000 |
0.000 0.000 | 0.000 |
| 2 spectra, GQILWFR | 0.000 | 0.038 | 0.000 | 0.000 | 0.000 | 0.962 | 0.000 | 0.000 | ||
| 2 spectra, EAVFGK | 0.000 | 0.108 | 0.063 | 0.000 | 0.000 | 0.695 | 0.135 | 0.000 | ||
| 6 spectra, MVTGDNINTAR | 0.000 | 0.017 | 0.000 | 0.012 | 0.000 | 0.971 | 0.000 | 0.000 | ||
| 1 spectrum, SSLYEGLEKPESR | 0.000 | 0.062 | 0.142 | 0.000 | 0.000 | 0.543 | 0.253 | 0.000 | ||
| 2 spectra, TSPNEGLSGNPADLER | 0.000 | 0.000 | 0.000 | 0.000 | 0.000 | 1.000 | 0.000 | 0.000 | ||
| 2 spectra, NKPLISR | 0.000 | 0.000 | 0.000 | 0.000 | 0.000 | 1.000 | 0.000 | 0.000 | ||
| 2 spectra, TGTLTMNR | 0.000 | 0.015 | 0.000 | 0.093 | 0.116 | 0.775 | 0.000 | 0.000 | ||
| 2 spectra, QDGAIENR | 0.000 | 0.000 | 0.000 | 0.027 | 0.000 | 0.973 | 0.000 | 0.000 | ||
| 2 spectra, FFDIDSGR | 0.000 | 0.000 | 0.000 | 0.000 | 0.000 | 1.000 | 0.000 | 0.000 | ||
| 2 spectra, AVMWGR | 0.000 | 0.000 | 0.000 | 0.000 | 0.000 | 1.000 | 0.000 | 0.000 | ||
| 2 spectra, ILSANGEAK | 0.000 | 0.000 | 0.000 | 0.012 | 0.000 | 0.988 | 0.000 | 0.000 | ||
| 4 spectra, EANHDGDFGITLAELR | 0.000 | 0.063 | 0.000 | 0.040 | 0.000 | 0.829 | 0.068 | 0.000 | ||
| 3 spectra, TICLAFR | 0.000 | 0.000 | 0.148 | 0.181 | 0.000 | 0.541 | 0.130 | 0.000 | ||
| 1 spectrum, SVLQGK | 0.000 | 0.000 | 0.000 | 0.000 | 0.000 | 1.000 | 0.000 | 0.000 | ||
| 2 spectra, IQTQIR | 0.000 | 0.000 | 0.000 | 0.014 | 0.000 | 0.986 | 0.000 | 0.000 | ||
| 2 spectra, SSPTDK | 0.000 | 0.000 | 0.074 | 0.000 | 0.000 | 0.830 | 0.092 | 0.004 | ||
| 1 spectrum, GASEILLK | 0.000 | 0.002 | 0.000 | 0.006 | 0.000 | 0.992 | 0.000 | 0.000 | ||
| 2 spectra, SMSTVIK | 0.035 | 0.049 | 0.000 | 0.000 | 0.000 | 0.915 | 0.000 | 0.000 | ||
| 2 spectra, ALMELR | 0.000 | 0.251 | 0.000 | 0.000 | 0.000 | 0.708 | 0.042 | 0.000 | ||
| 5 spectra, GIIDSTVSEQR | 0.000 | 0.000 | 0.000 | 0.149 | 0.000 | 0.851 | 0.000 | 0.000 | ||
| 2 spectra, VYTFNSVR | 0.000 | 0.056 | 0.000 | 0.029 | 0.014 | 0.901 | 0.000 | 0.000 | ||
| 3 spectra, TVIEPMASEGLR | 0.000 | 0.026 | 0.000 | 0.000 | 0.000 | 0.974 | 0.000 | 0.000 | ||
| 1 spectrum, TECALLGFILDLK | 0.000 | 0.000 | 0.000 | 0.088 | 0.000 | 0.912 | 0.000 | 0.000 |
| Plot | Mito | Lyso or Perox | ER | Golgi | PM | Cytosol | Nucleus | ||||||
| Expt B |
10 peptides |
12 spectra |
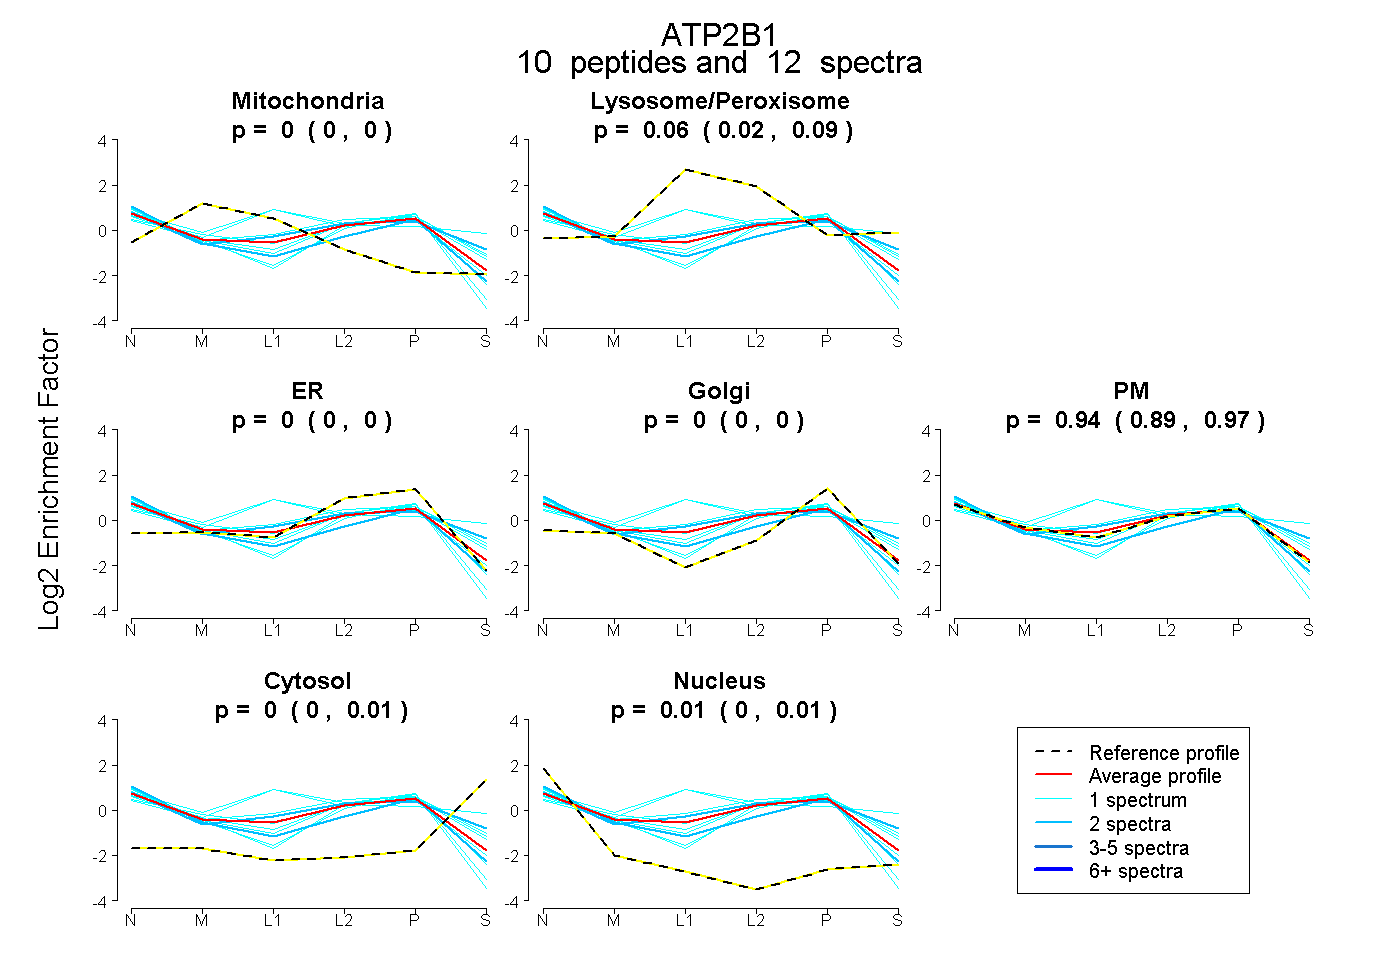 |
0.000 0.000 | 0.000 |
0.056 0.020 | 0.086 |
0.000 0.000 | 0.000 |
0.000 0.000 | 0.000 |
0.939 0.894 | 0.970 |
0.000 0.000 | 0.011 |
0.005 0.000 | 0.012 |
|||
| Plot | Lyso | Other | |||||||||||
| Expt C |
36 peptides |
125 spectra |
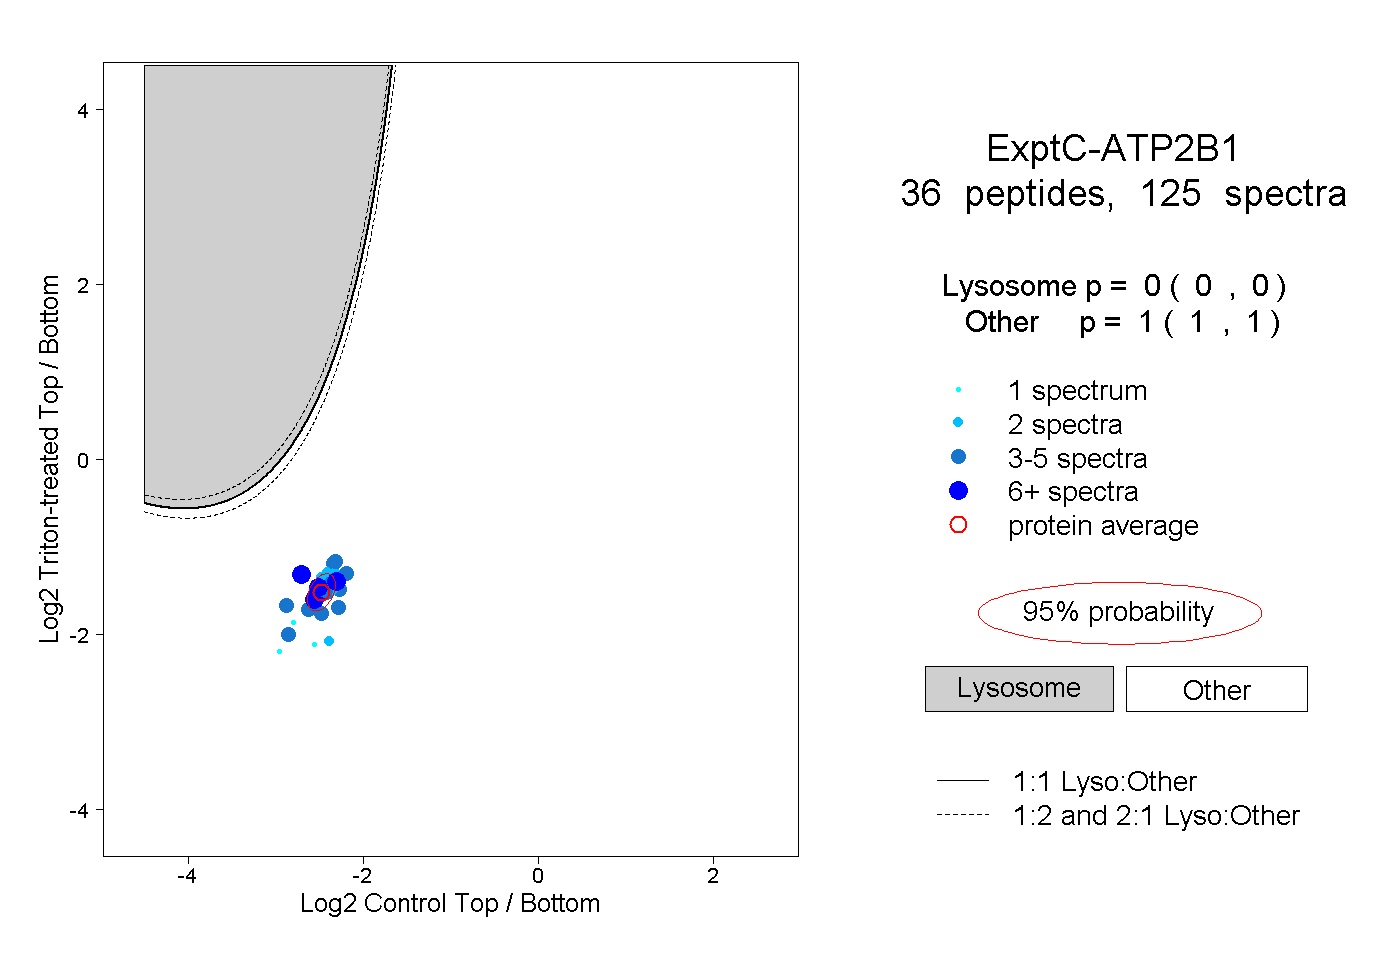 |
0.000 0.000 | 0.000 |
1.000 1.000 | 1.000 |
||||||||
| Plot | Lyso | Other | |||||||||||
| Expt D |
4 peptides |
6 spectra |
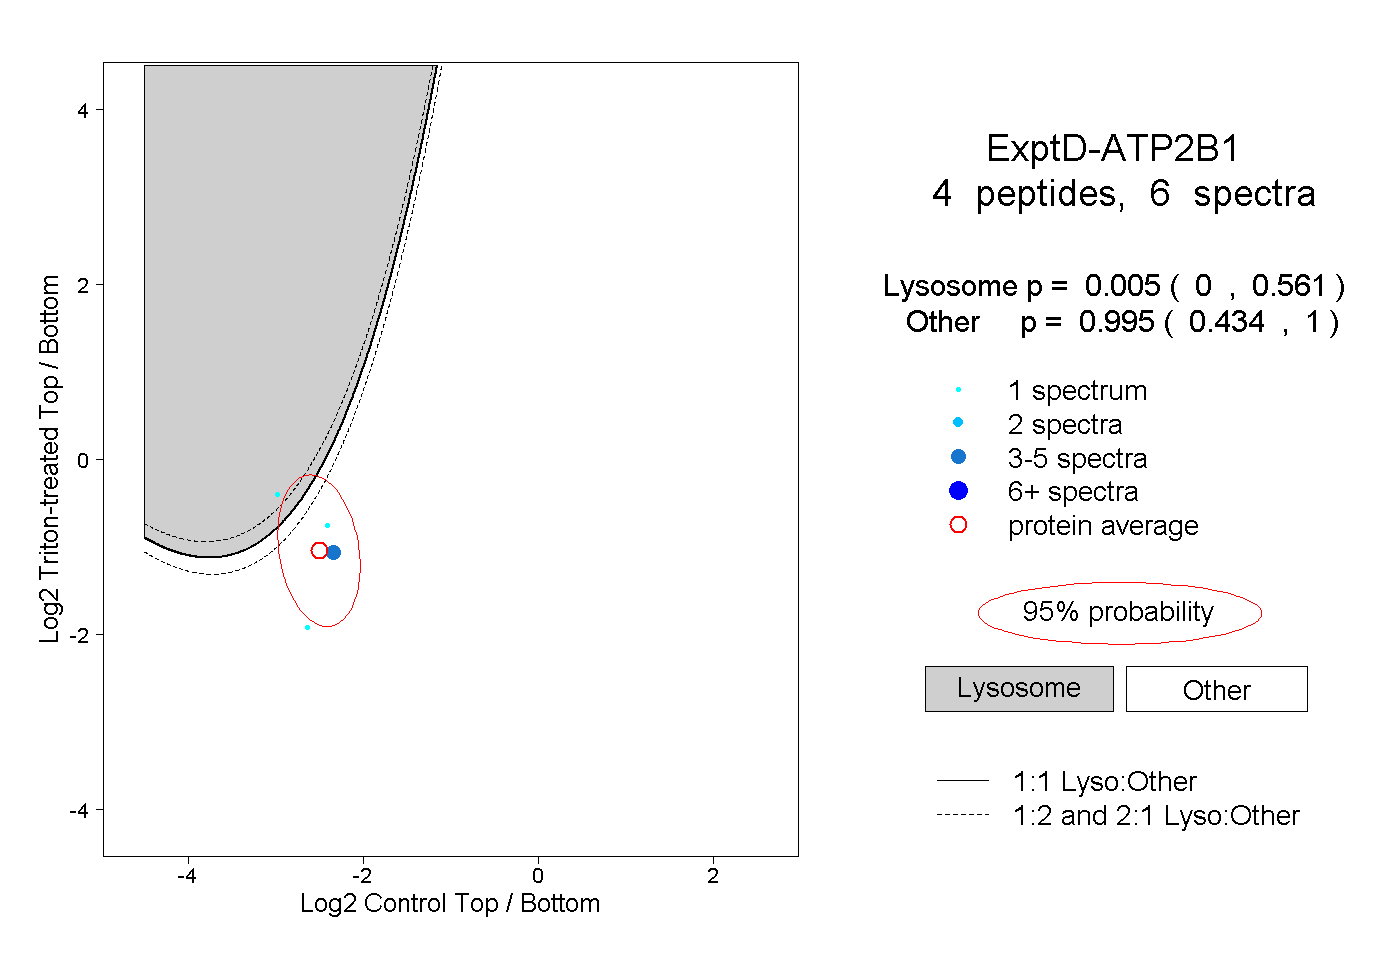 |
0.005 0.000 | 0.561 |
0.995 0.434 | 1.000 |