 23
23peptides
spectra
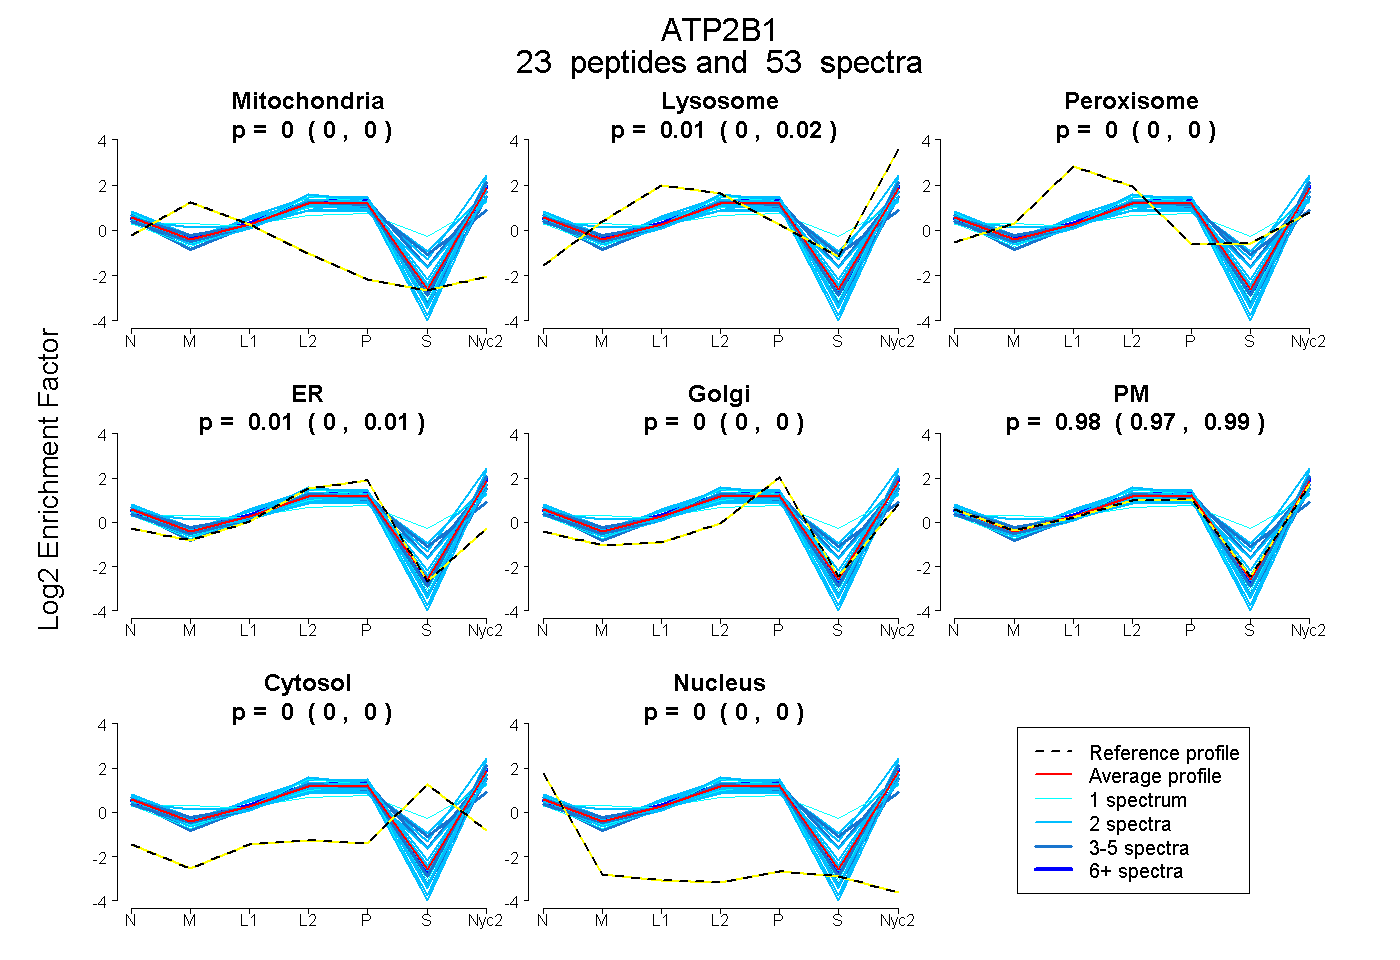
0.000 | 0.000
0.004 | 0.015
0.000 | 0.000
0.002 | 0.014
0.000 | 0.000
0.973 | 0.989
0.000 | 0.000
0.000 | 0.000
10peptides
spectra
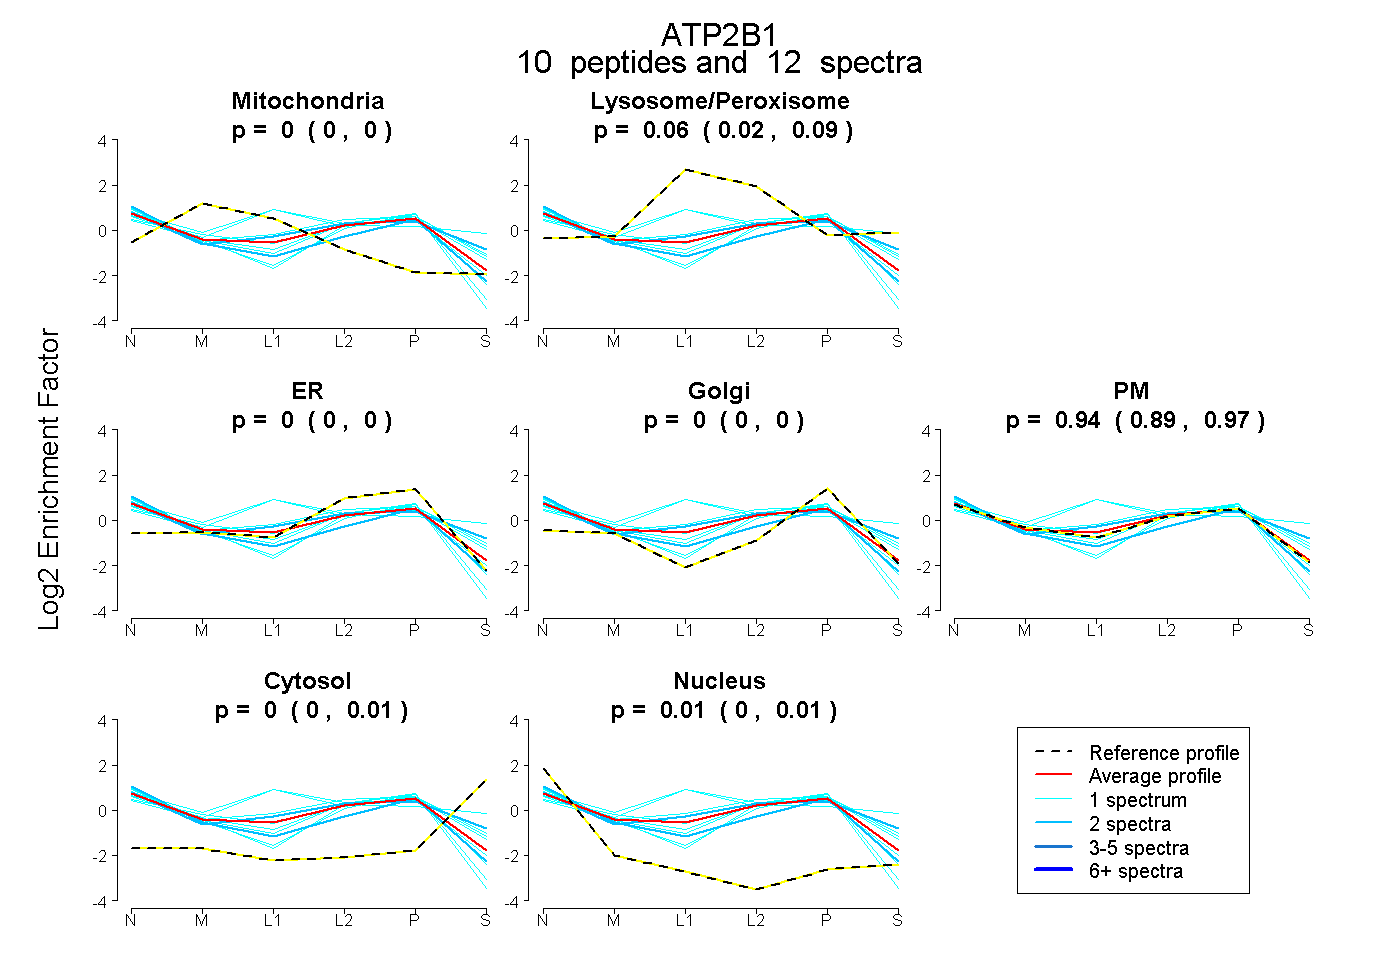
0.000 | 0.000
0.020 | 0.086
0.000 | 0.000
0.000 | 0.000
0.894 | 0.970
0.000 | 0.011
0.000 | 0.012
36peptides
spectra
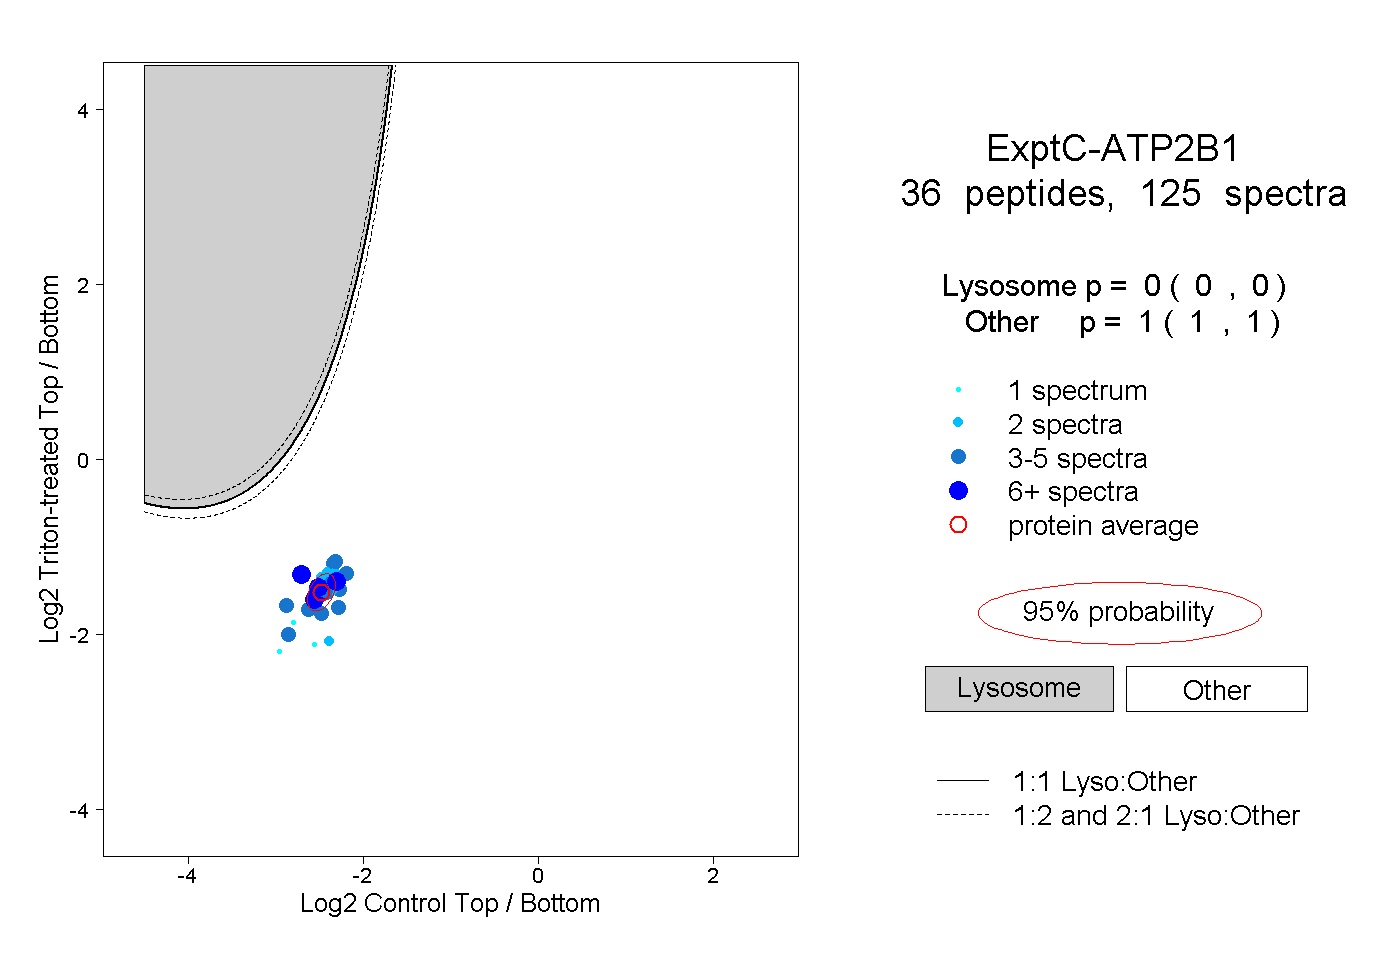
0.000 | 0.000
1.000 | 1.000
4peptides
spectra
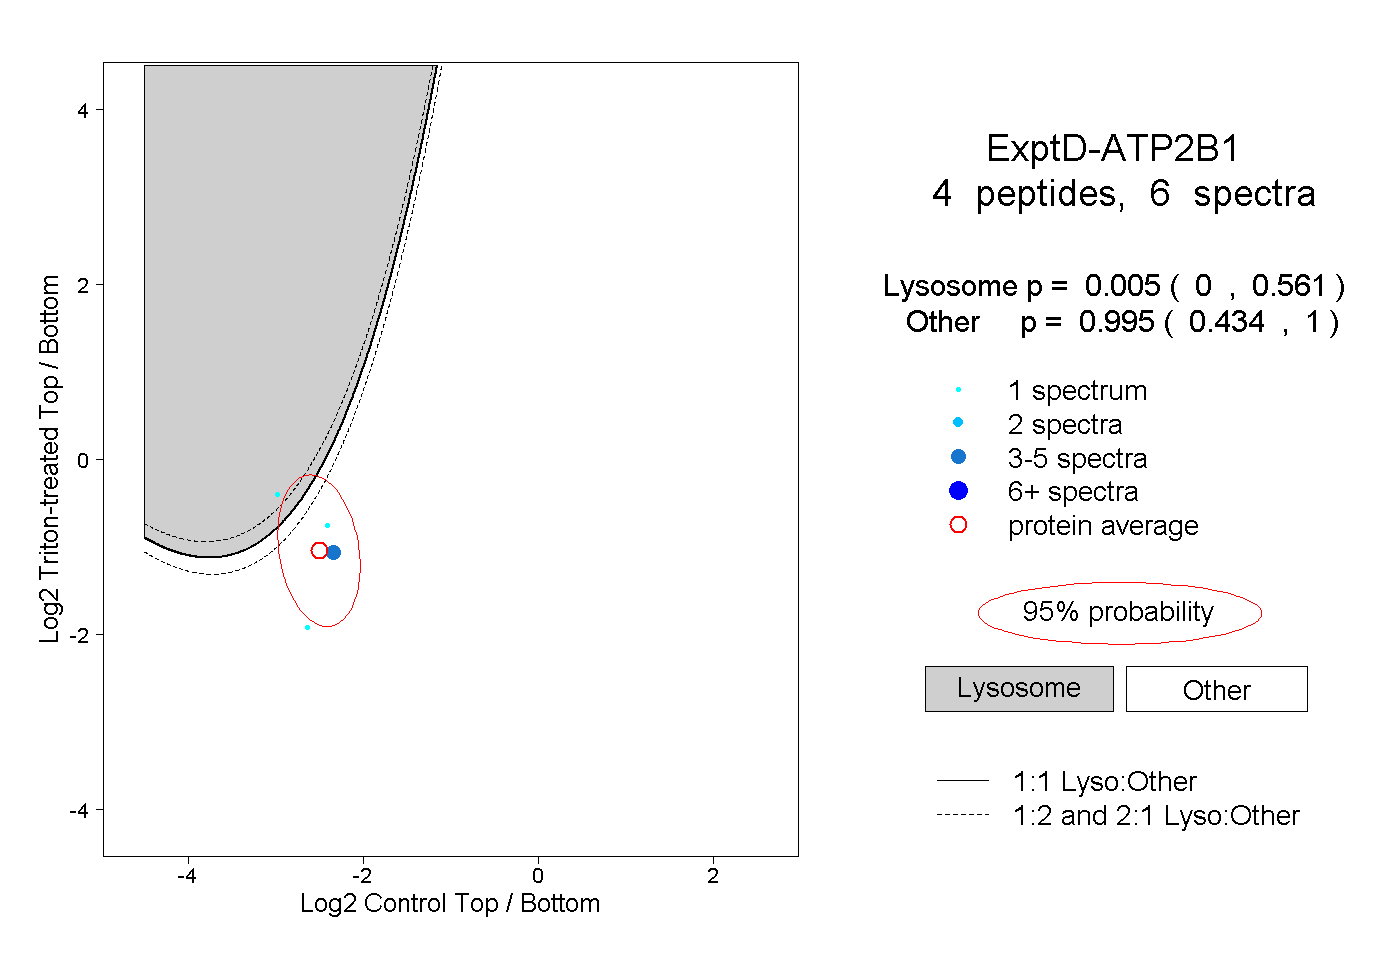
0.000 | 0.561
0.434 | 1.000