VASN
[ENSRNOP00000005490]
Main page
| | | Plot |
Mito |
Lyso |
|
Perox |
ER |
Golgi |
PM |
Cytosol |
Nucleus |
|
| Expt A |
 8
8
peptides |
26
spectra |
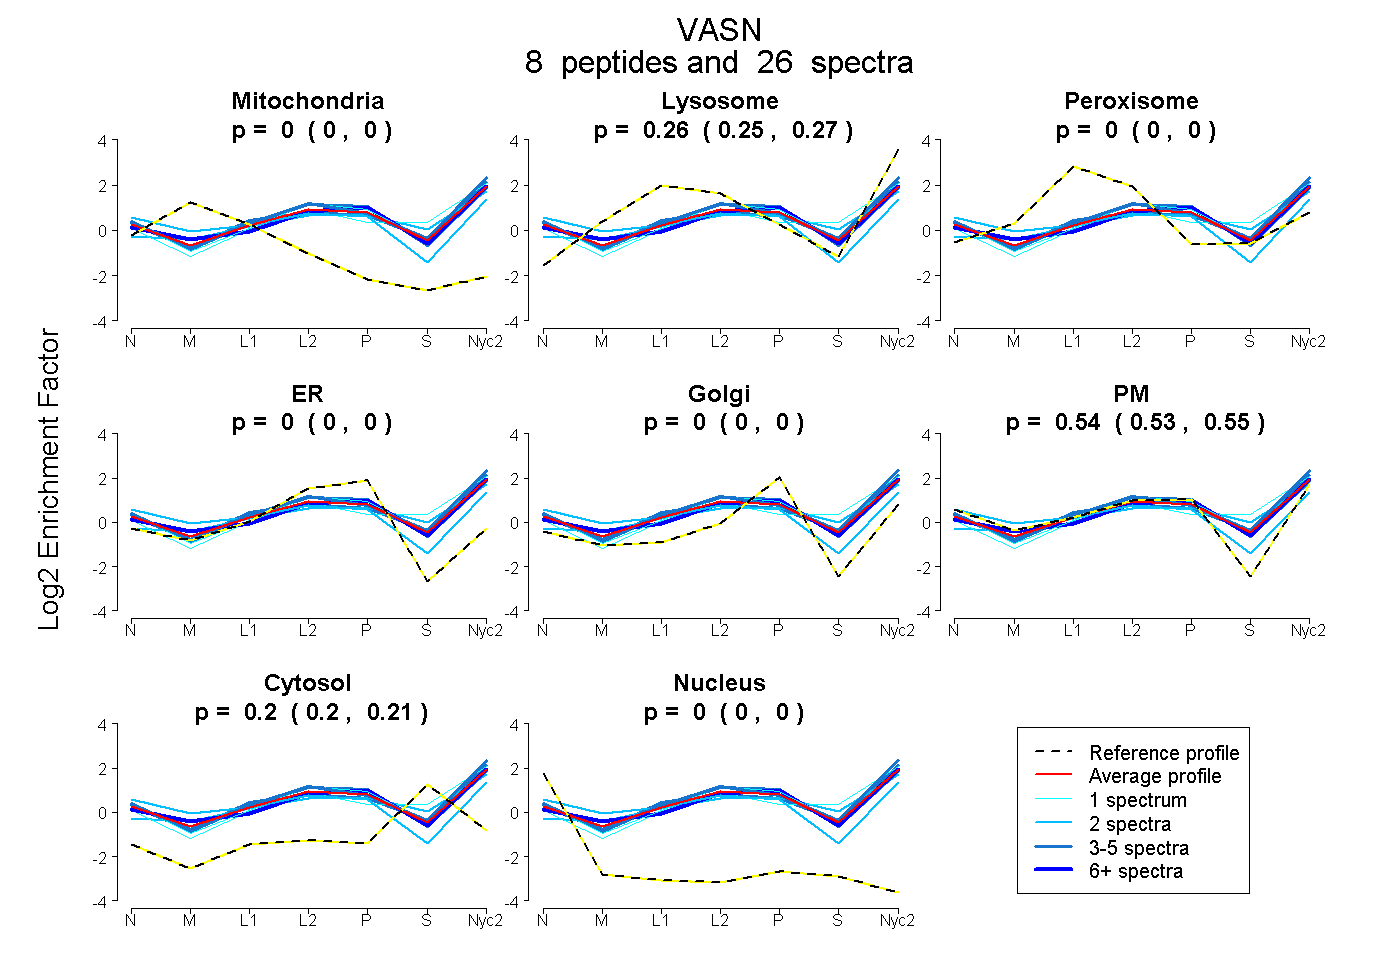 |
0.000
0.000 | 0.000 |
0.257
0.246 | 0.266 |
|
0.000
0.000 | 0.001 |
0.000
0.000 | 0.000 |
0.000
0.000 | 0.000 |
0.539
0.525 | 0.550 |
0.204
0.197 | 0.210 |
0.000
0.000 | 0.000 |
|
| | | Plot |
Mito |
|
Lyso or Perox |
|
ER |
Golgi |
PM |
Cytosol |
Nucleus |
|
| Expt B |
2
peptides |
2
spectra |
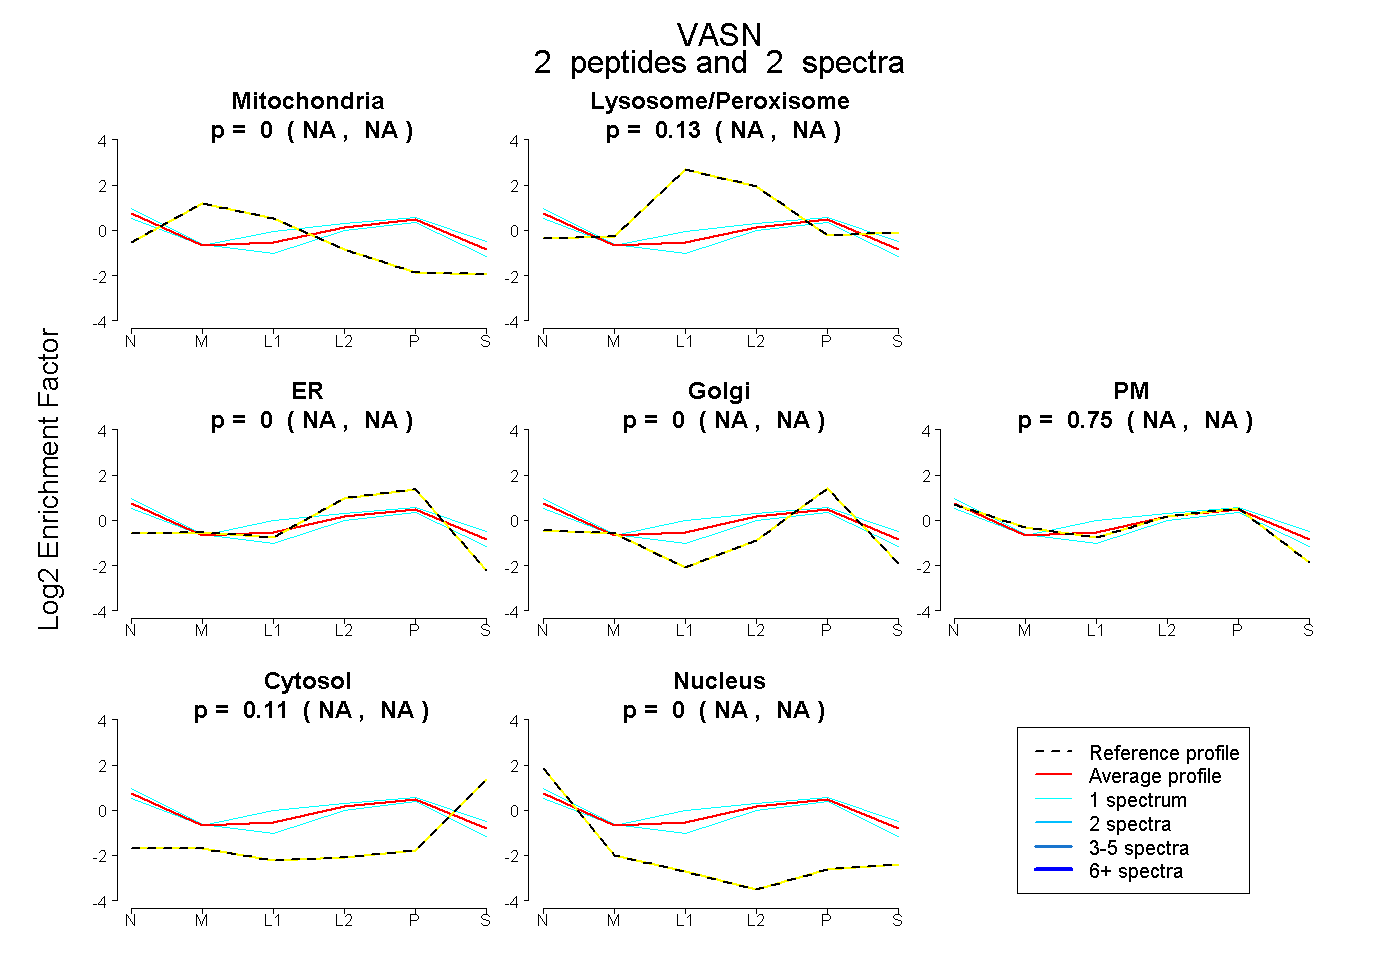 |
0.000
NA | NA |
|
0.132
NA | NA |
|
0.000
NA | NA |
0.000
NA | NA |
0.755
NA | NA |
0.113
NA | NA |
0.000
NA | NA |
|
| | | Plot |
|
Lyso |
|
|
|
|
|
|
|
Other |
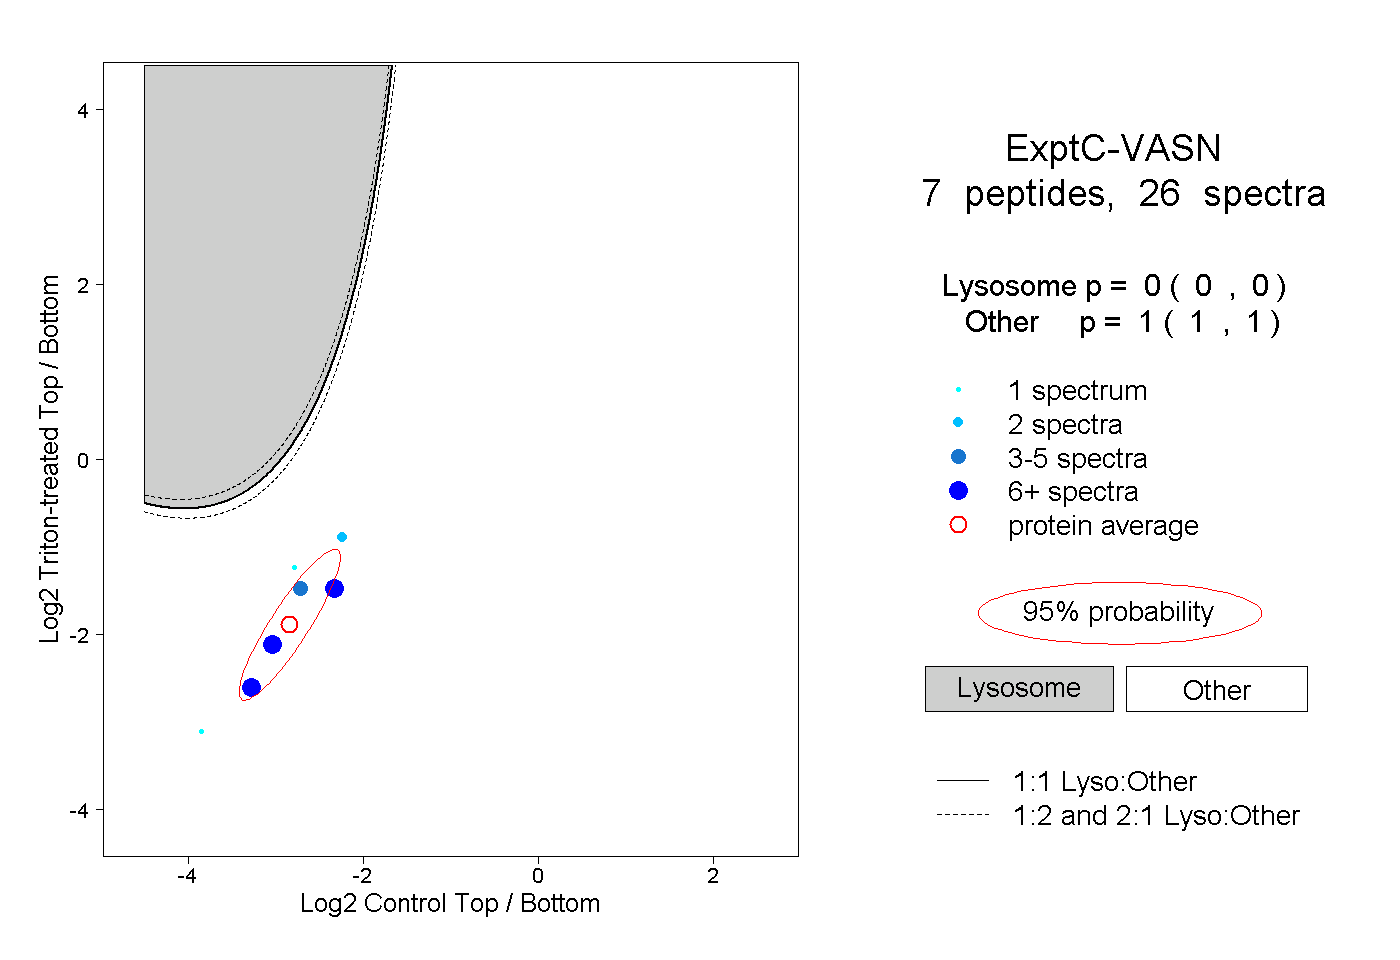
| Expt C |
7
peptides |
26
spectra |
 |
|
0.000
0.000 | 0.000 |
|
|
|
|
|
|
|
1.000
1.000 | 1.000 |
| 1 spectrum, QGTTVPR |
|
0.000 |
|
|
|
|
|
|
|
1.000 |
| 2 spectra, LPDNELR |
|
0.000 |
|
|
|
|
|
|
|
1.000 |
| 6 spectra, VLPPLHLPR |
|
0.000 |
|
|
|
|
|
|
|
1.000 |
| 1 spectrum, LAGLLGR |
|
0.000 |
|
|
|
|
|
|
|
1.000 |
| 6 spectra, ESHVVLASPEETR |
|
0.000 |
|
|
|
|
|
|
|
1.000 |
| 4 spectra, ASSTAQDK |
|
0.000 |
|
|
|
|
|
|
|
1.000 |
| 6 spectra, LAGLGLR |
|
0.000 |
|
|
|
|
|
|
|
1.000 |
| | | Plot |
|
Lyso |
|
|
|
|
|
|
|
Other |
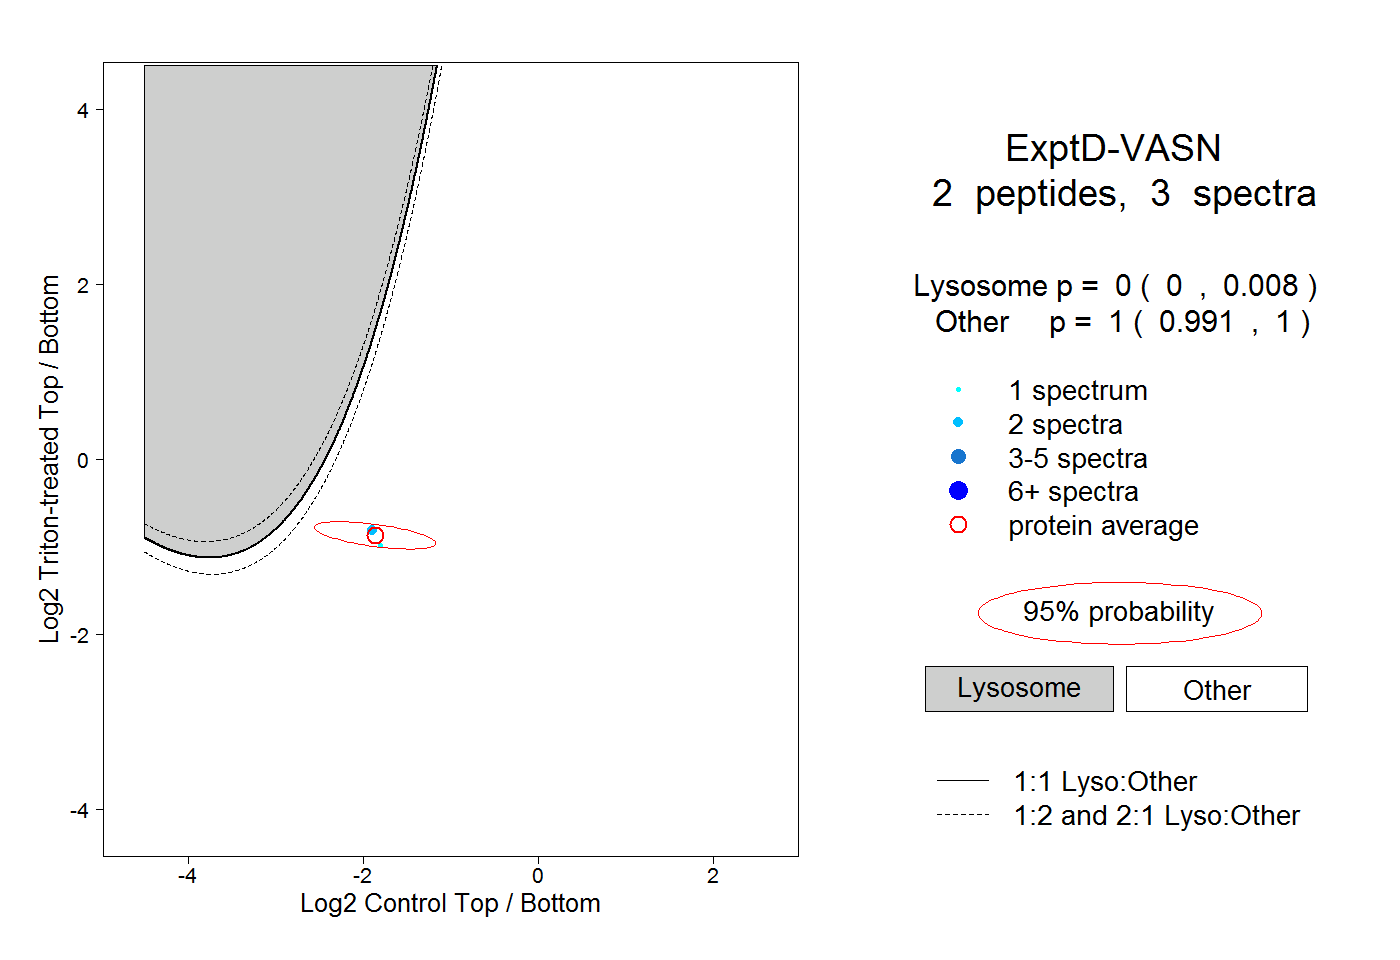
| Expt D |
2
peptides |
3
spectra |
 |
|
0.000
0.000 | 0.008 |
|
|
|
|
|
|
|
1.000
0.991 | 1.000 |