 8
8peptides
spectra
0.000 | 0.000
0.246 | 0.266
0.000 | 0.001
0.000 | 0.000
0.000 | 0.000
0.525 | 0.550
0.197 | 0.210
0.000 | 0.000
2peptides
spectra
NA | NA
NA | NA
NA | NA
NA | NA
NA | NA
NA | NA
NA | NA
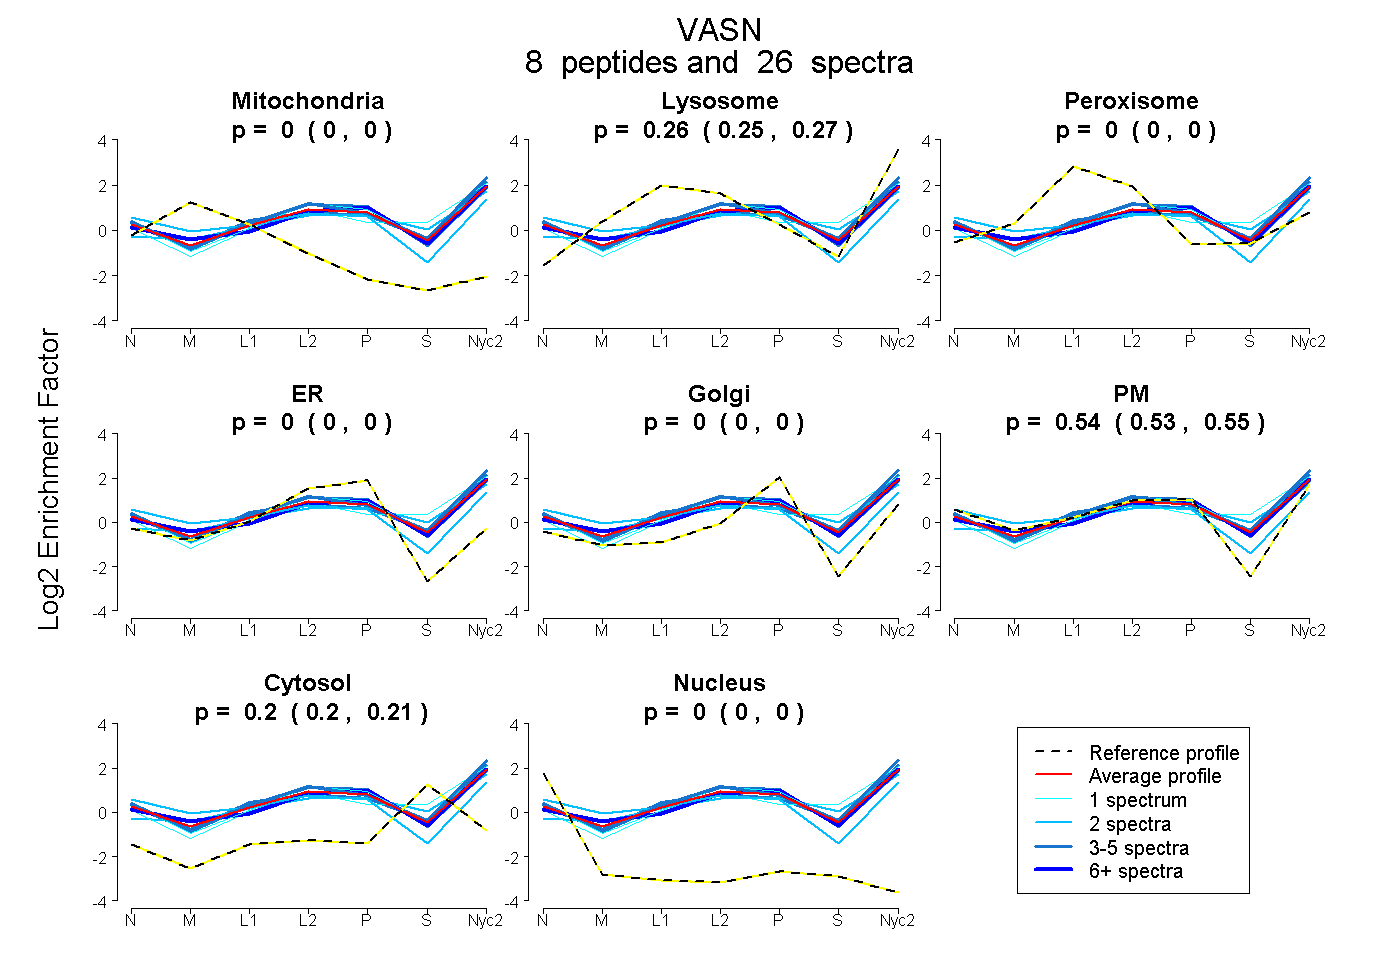
| Plot | Mito | Lyso | Perox | ER | Golgi | PM | Cytosol | Nucleus | |||||
| Expt A |
8 peptides |
26 spectra |
|
0.000 0.000 | 0.000 |
0.257 0.246 | 0.266 |
0.000 0.000 | 0.001 |
0.000 0.000 | 0.000 |
0.000 0.000 | 0.000 |
0.539 0.525 | 0.550 |
0.204 0.197 | 0.210 |
0.000 0.000 | 0.000 |
||
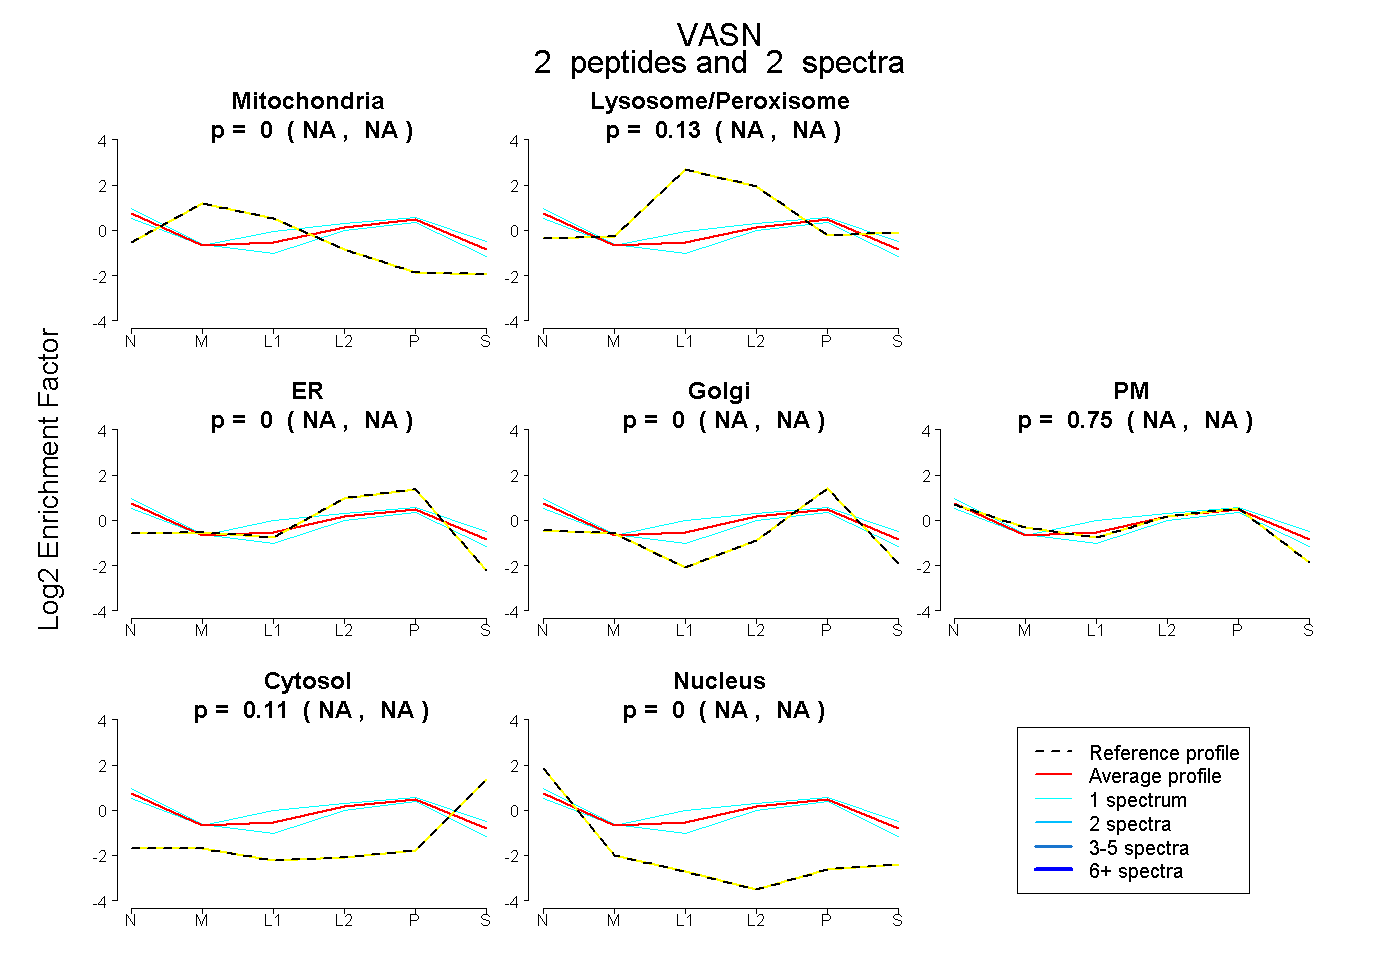
| Plot | Mito | Lyso or Perox | ER | Golgi | PM | Cytosol | Nucleus | ||||||
| Expt B |
2 peptides |
2 spectra |
|
0.000 NA | NA |
0.132 NA | NA |
0.000 NA | NA |
0.000 NA | NA |
0.755 NA | NA |
0.113 NA | NA |
0.000 NA | NA |
| 1 spectrum, VLPPLHLPR | 0.000 | 0.278 | 0.000 | 0.041 | 0.568 | 0.113 | 0.000 | |||
| 1 spectrum, LAGLGLR | 0.000 | 0.010 | 0.000 | 0.000 | 0.875 | 0.097 | 0.018 |
| Plot | Lyso | Other | |||||||||||
| Expt C |
7 peptides |
26 spectra |
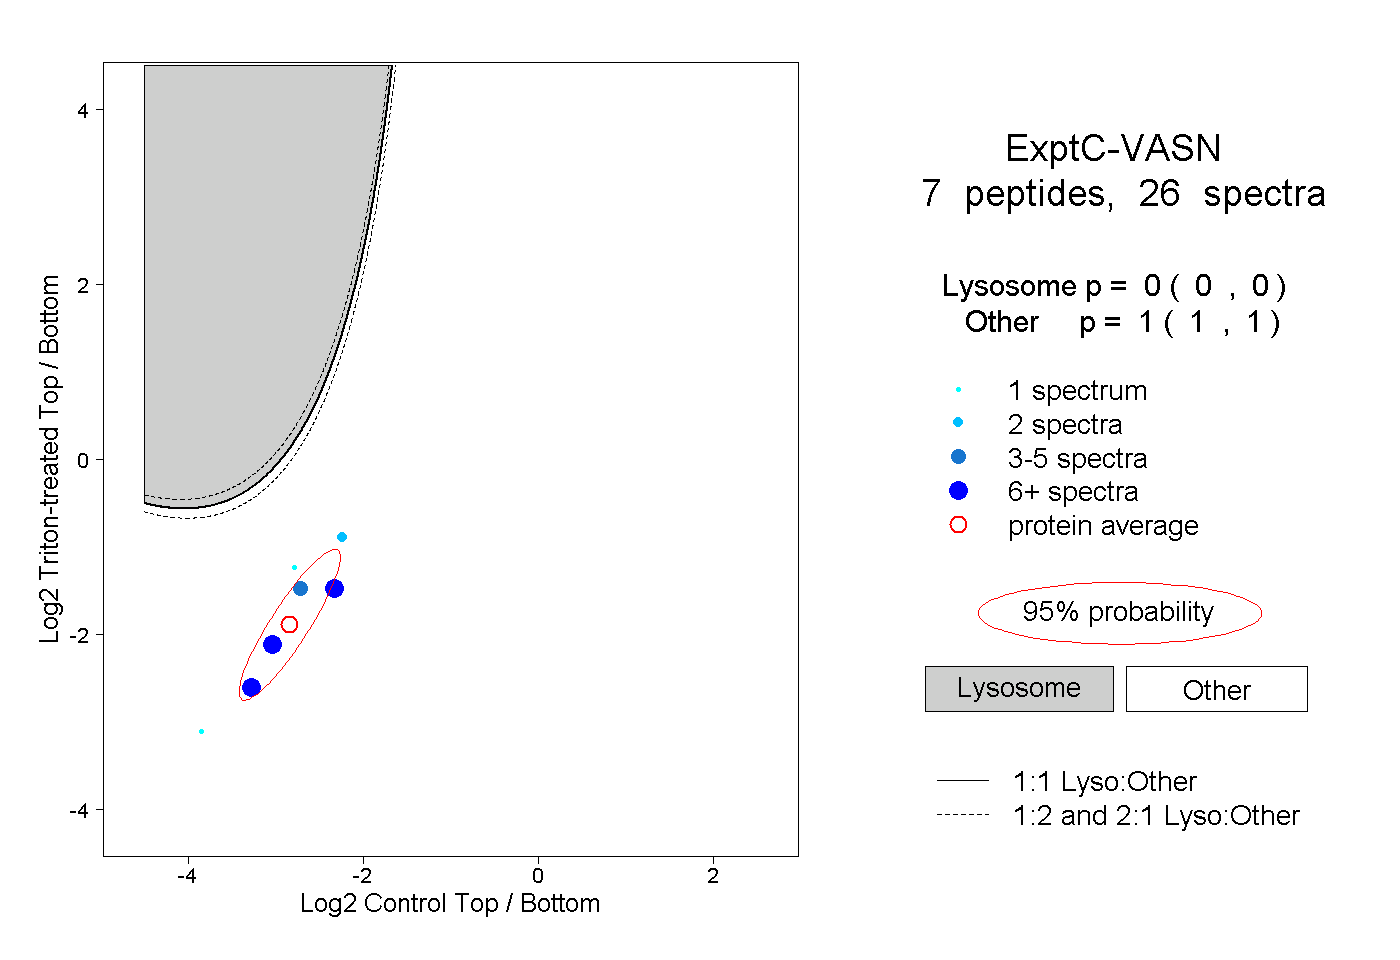 |
0.000 0.000 | 0.000 |
1.000 1.000 | 1.000 |
||||||||
| Plot | Lyso | Other | |||||||||||
| Expt D |
2 peptides |
3 spectra |
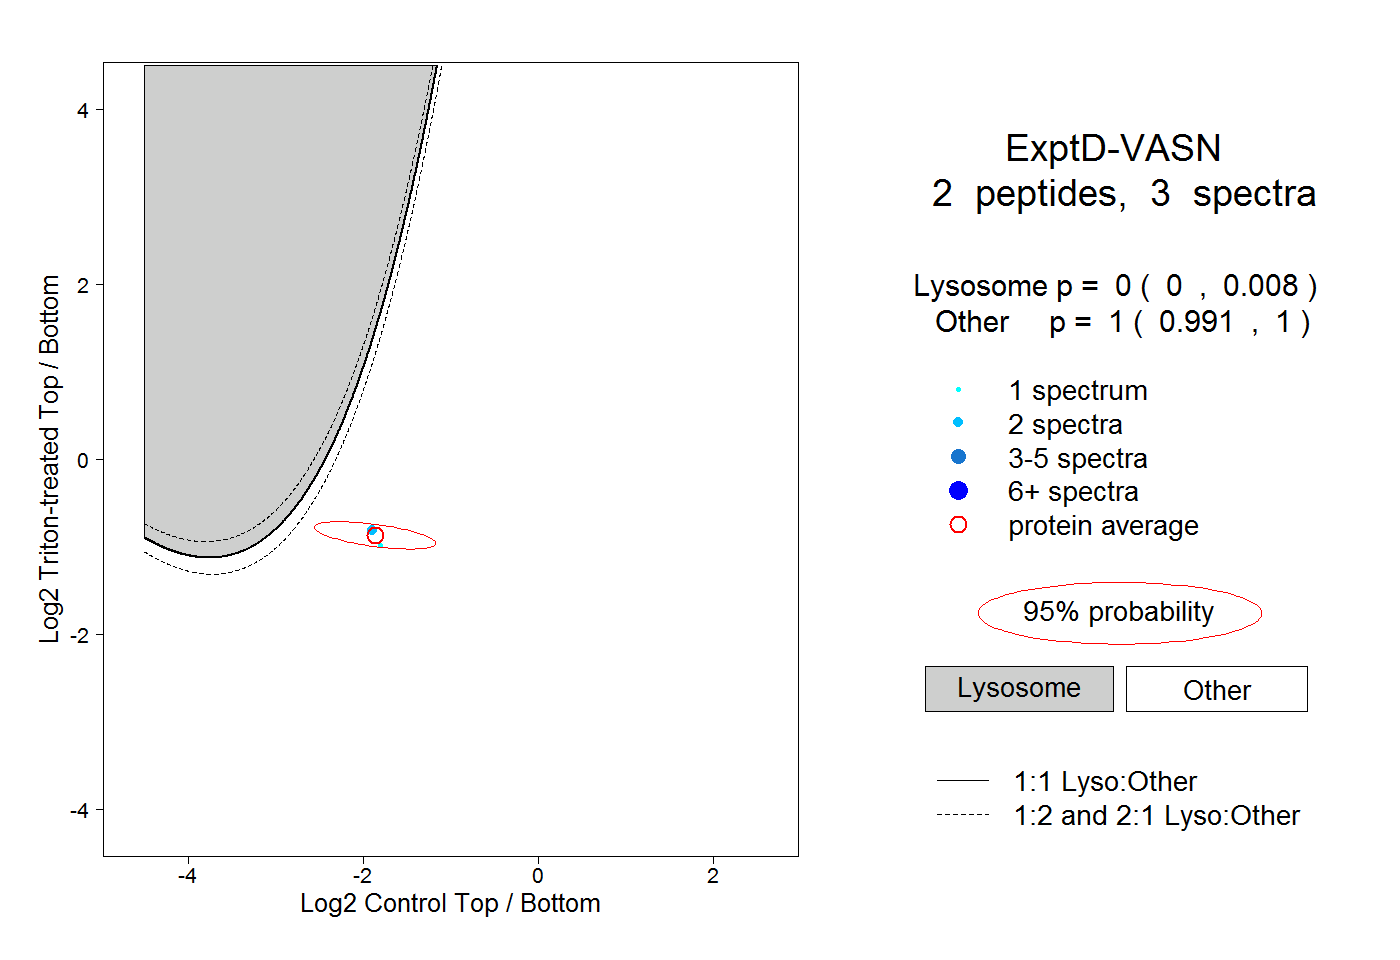 |
0.000 0.000 | 0.008 |
1.000 0.991 | 1.000 |