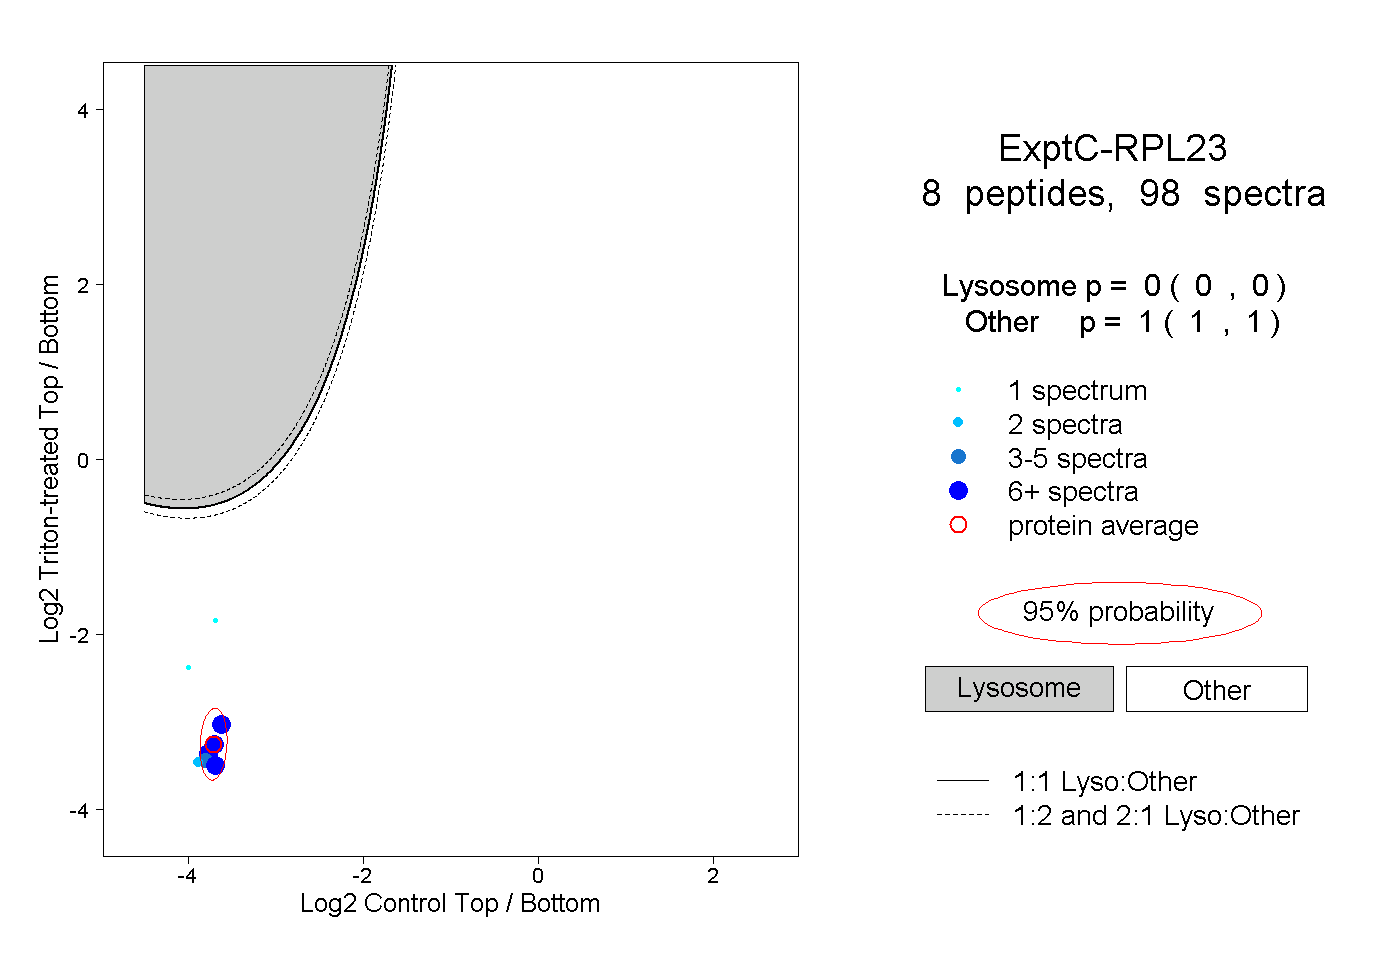
8
8peptides
spectra
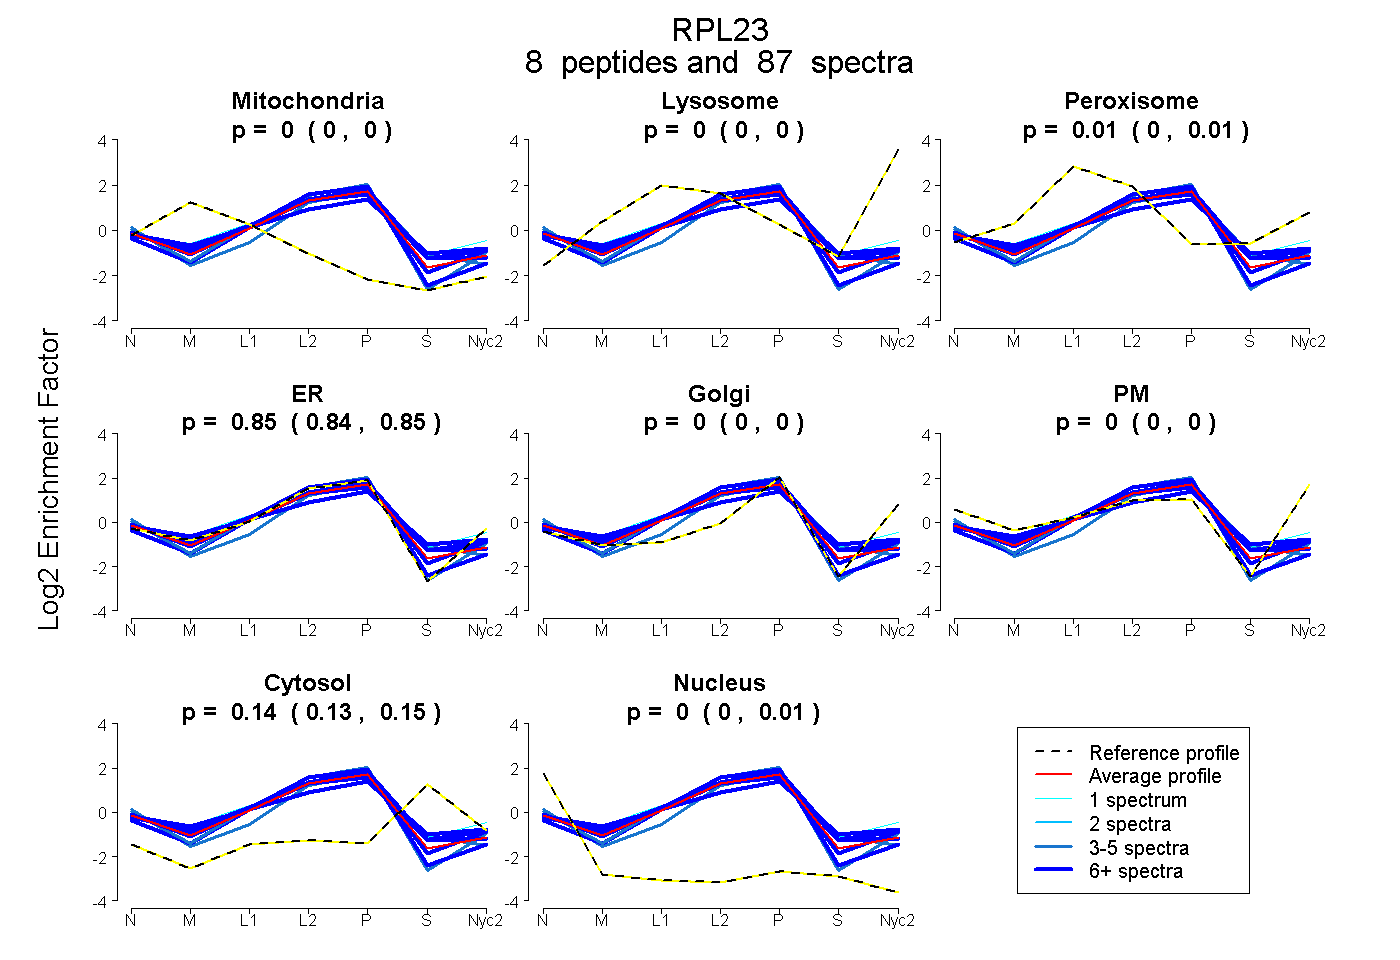
0.000 | 0.000
0.000 | 0.000
0.004 | 0.012
0.842 | 0.853
0.000 | 0.000
0.000 | 0.000
0.130 | 0.147
0.000 | 0.008
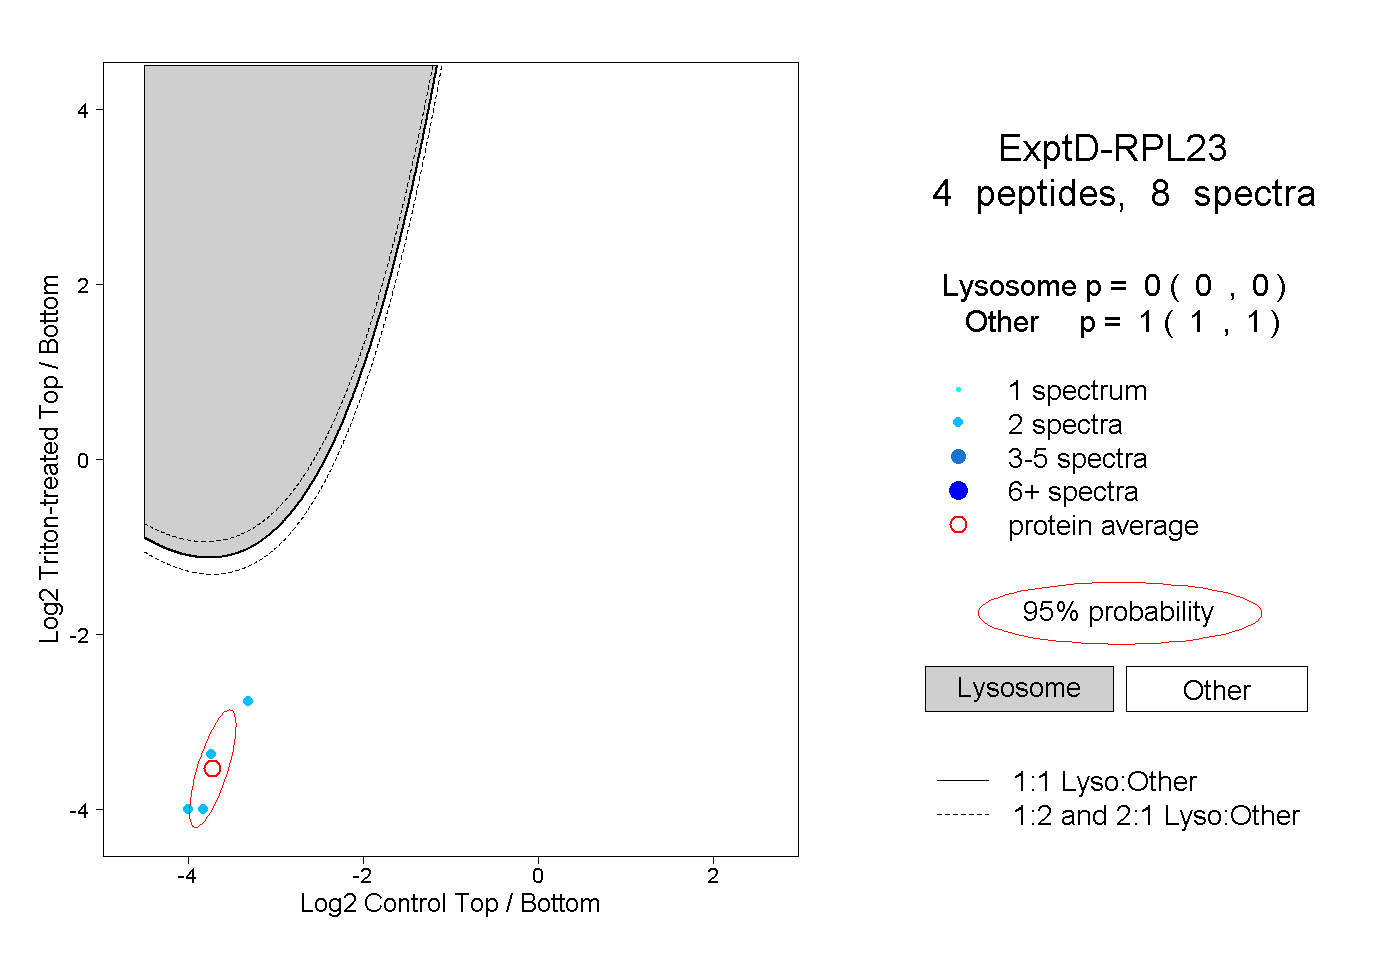
6peptides
spectra
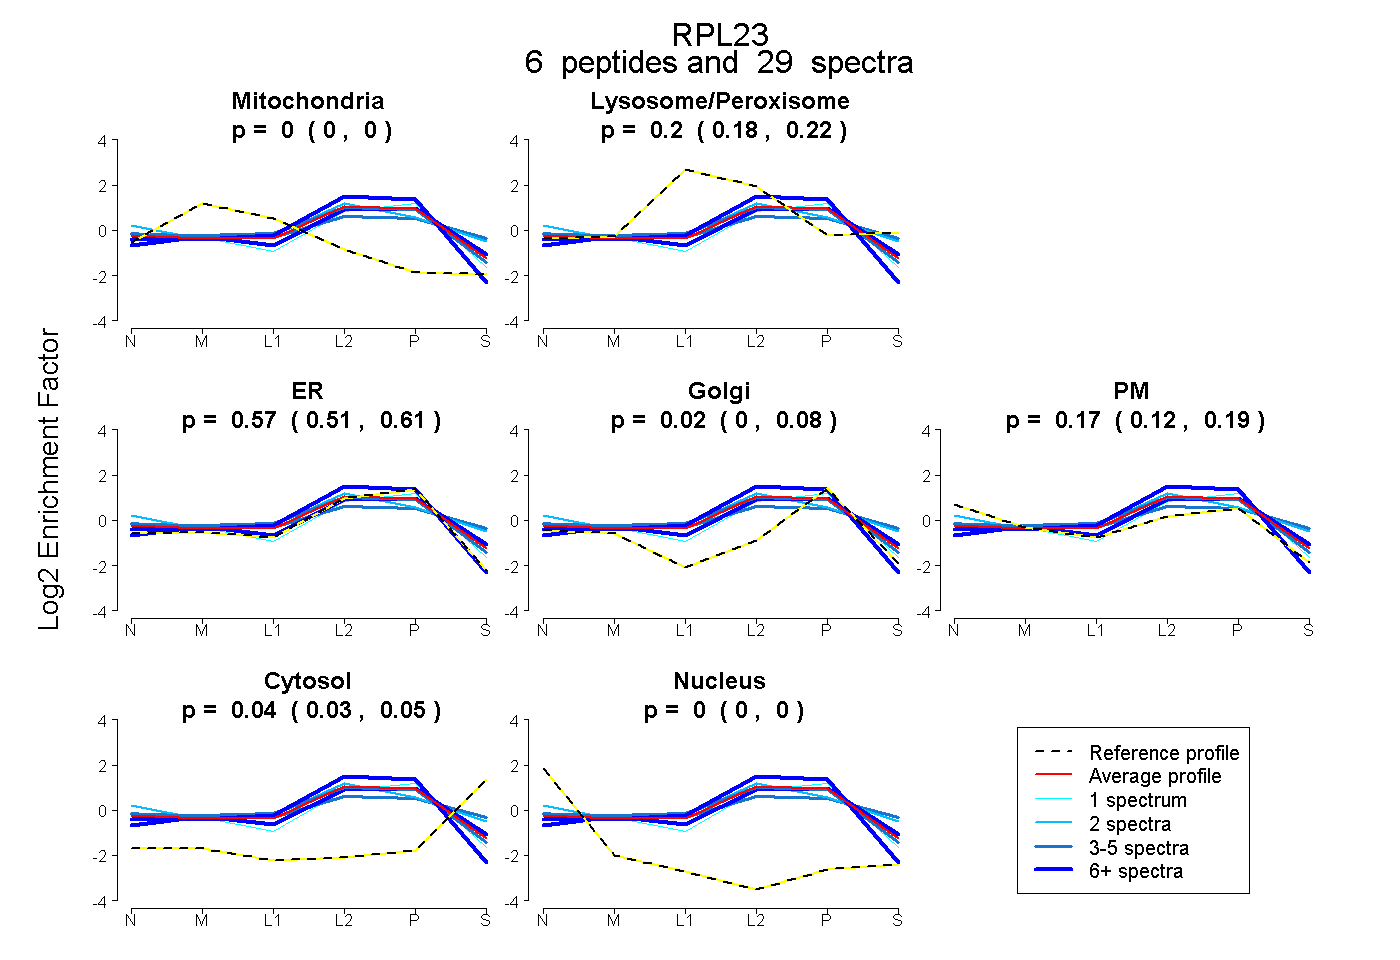
0.000 | 0.000
0.176 | 0.223
0.508 | 0.605
0.000 | 0.082
0.123 | 0.195
0.026 | 0.054
0.000 | 0.000