 8
8peptides
spectra
0.000 | 0.000
0.000 | 0.000
0.004 | 0.012
0.842 | 0.853
0.000 | 0.000
0.000 | 0.000
0.130 | 0.147
0.000 | 0.008
| Plot | Mito | Lyso | Perox | ER | Golgi | PM | Cytosol | Nucleus | |||||
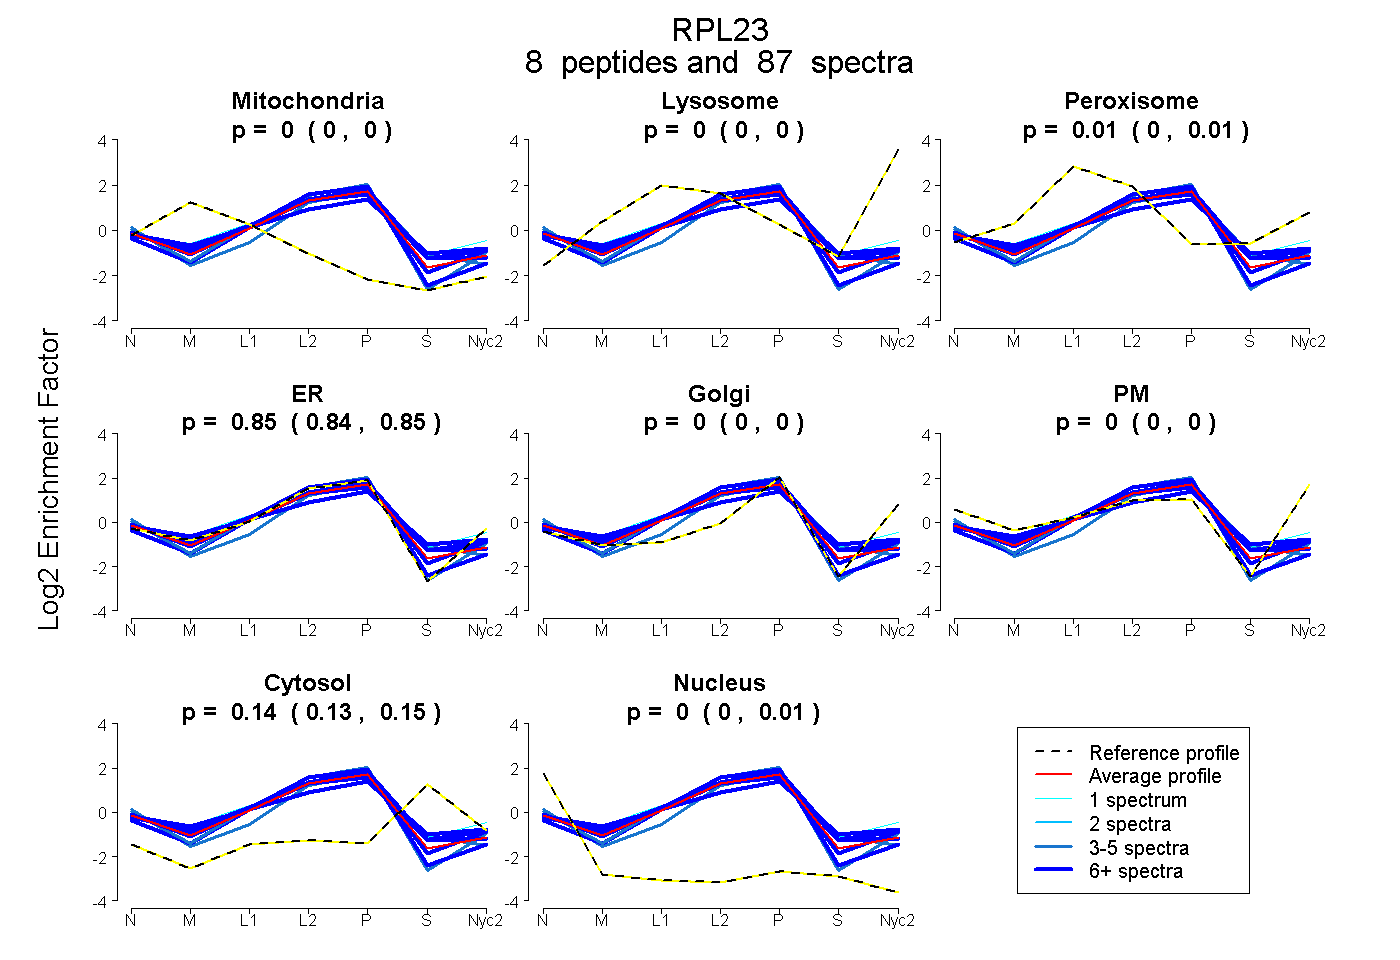
| Expt A |
8 peptides |
87 spectra |
|
0.000 0.000 | 0.000 |
0.000 0.000 | 0.000 |
0.008 0.004 | 0.012 |
0.848 0.842 | 0.853 |
0.000 0.000 | 0.000 |
0.000 0.000 | 0.000 |
0.140 0.130 | 0.147 |
0.004 0.000 | 0.008 |
| 8 spectra, ECADLWPR | 0.000 | 0.000 | 0.017 | 0.800 | 0.000 | 0.000 | 0.184 | 0.000 | ||
| 12 spectra, LPAAGVGDMVMATVK | 0.000 | 0.000 | 0.053 | 0.773 | 0.000 | 0.000 | 0.174 | 0.000 | ||
| 16 spectra, GSAITGPVAK | 0.005 | 0.000 | 0.111 | 0.672 | 0.000 | 0.000 | 0.213 | 0.000 | ||
| 4 spectra, GGSSGAK | 0.000 | 0.000 | 0.000 | 0.957 | 0.000 | 0.000 | 0.000 | 0.043 | ||
| 7 spectra, NLYIISVK | 0.013 | 0.000 | 0.044 | 0.852 | 0.000 | 0.000 | 0.091 | 0.000 | ||
| 36 spectra, VHPAVVIR | 0.000 | 0.000 | 0.000 | 0.943 | 0.000 | 0.000 | 0.000 | 0.057 | ||
| 1 spectrum, GKPELR | 0.000 | 0.000 | 0.157 | 0.710 | 0.000 | 0.000 | 0.133 | 0.000 | ||
| 3 spectra, DGVFLYFEDNAGVIVNNK | 0.000 | 0.000 | 0.000 | 0.747 | 0.000 | 0.000 | 0.212 | 0.041 |
| Plot | Mito | Lyso or Perox | ER | Golgi | PM | Cytosol | Nucleus | ||||||
| Expt B |
6 peptides |
29 spectra |
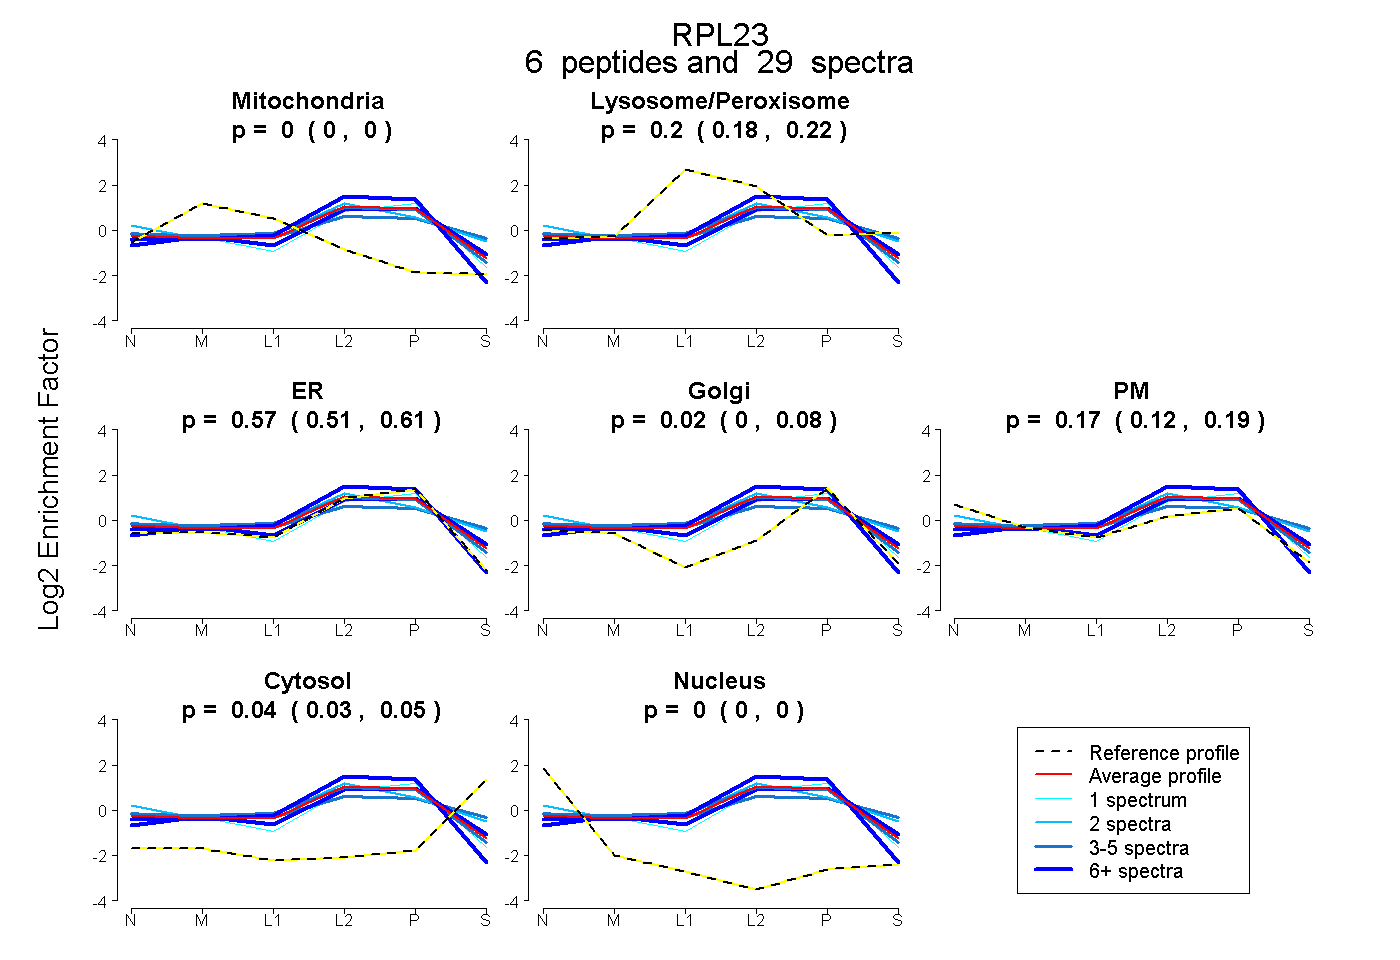 |
0.000 0.000 | 0.000 |
0.197 0.176 | 0.223 |
0.570 0.508 | 0.605 |
0.025 0.000 | 0.082 |
0.166 0.123 | 0.195 |
0.042 0.026 | 0.054 |
0.000 0.000 | 0.000 |
|||
| Plot | Lyso | Other | |||||||||||
| Expt C |
8 peptides |
98 spectra |
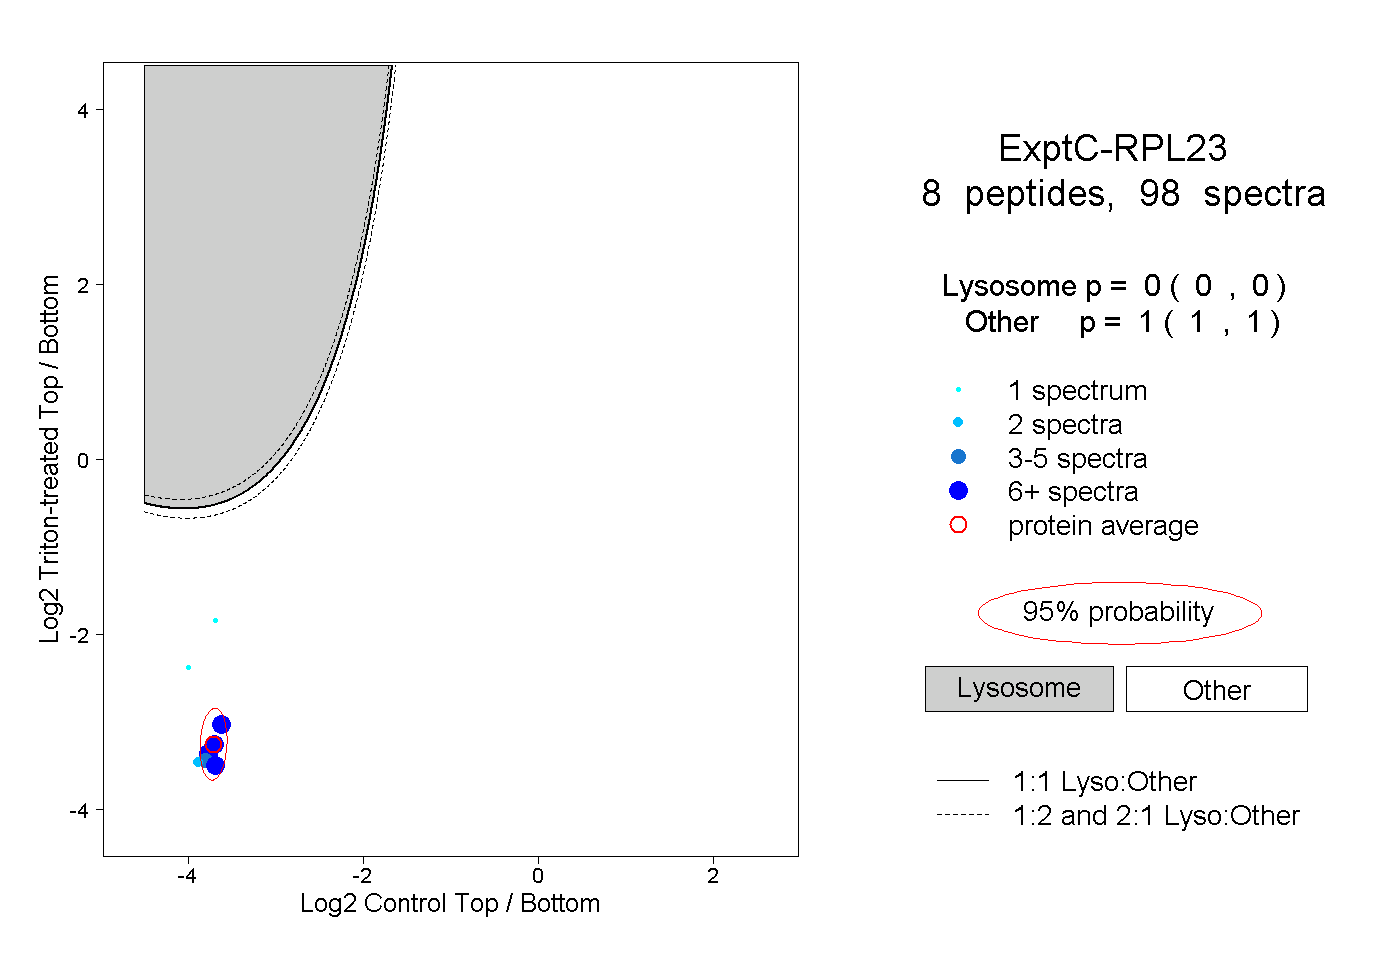 |
0.000 0.000 | 0.000 |
1.000 1.000 | 1.000 |
||||||||
| Plot | Lyso | Other | |||||||||||
| Expt D |
4 peptides |
8 spectra |
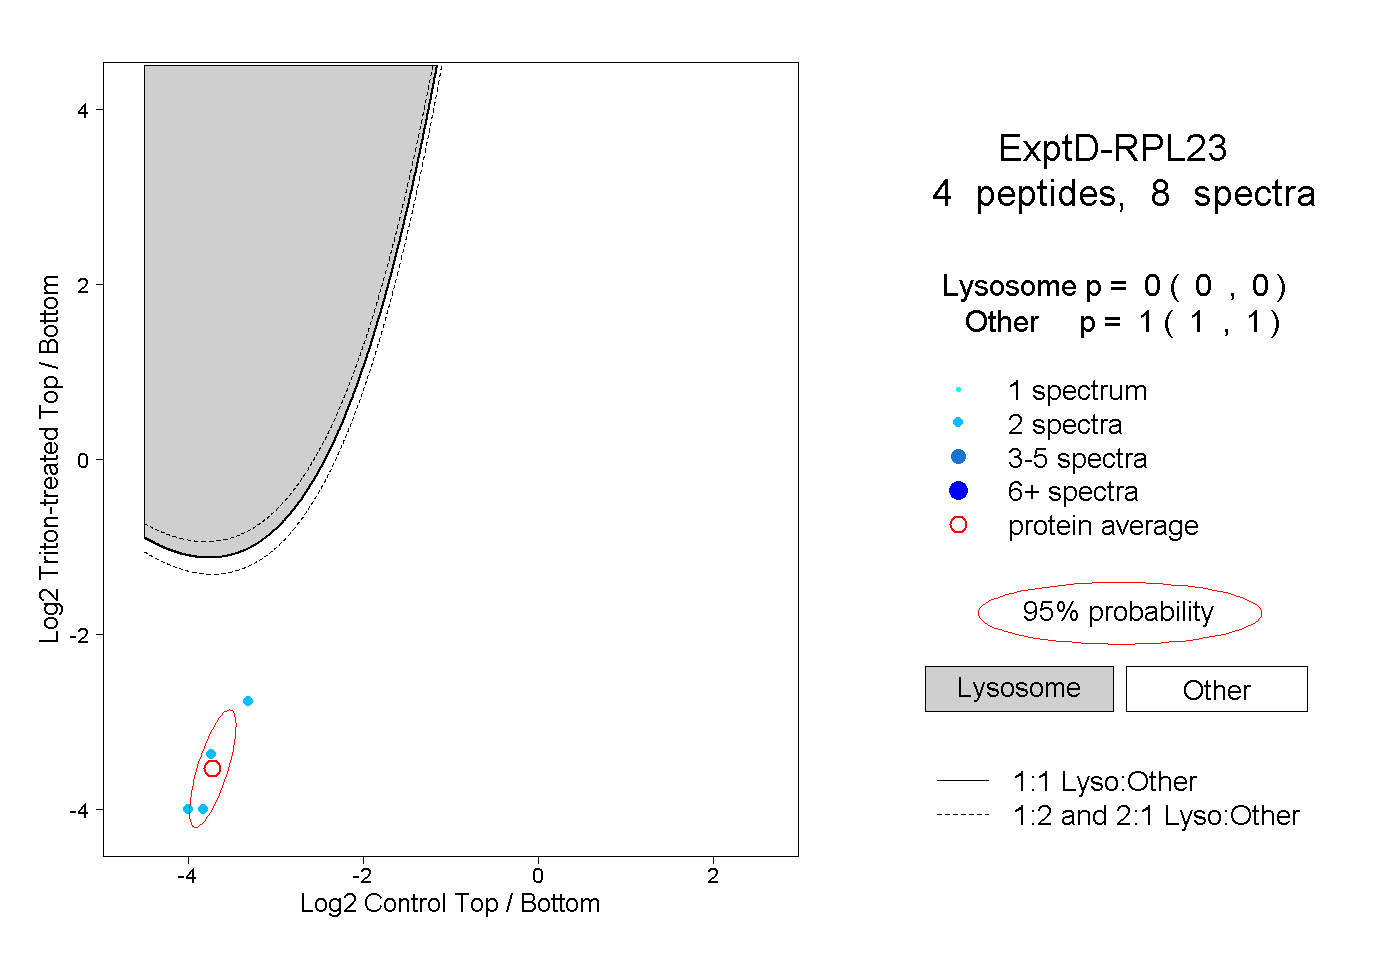 |
0.000 0.000 | 0.000 |
1.000 1.000 | 1.000 |