 4
4peptides
spectra
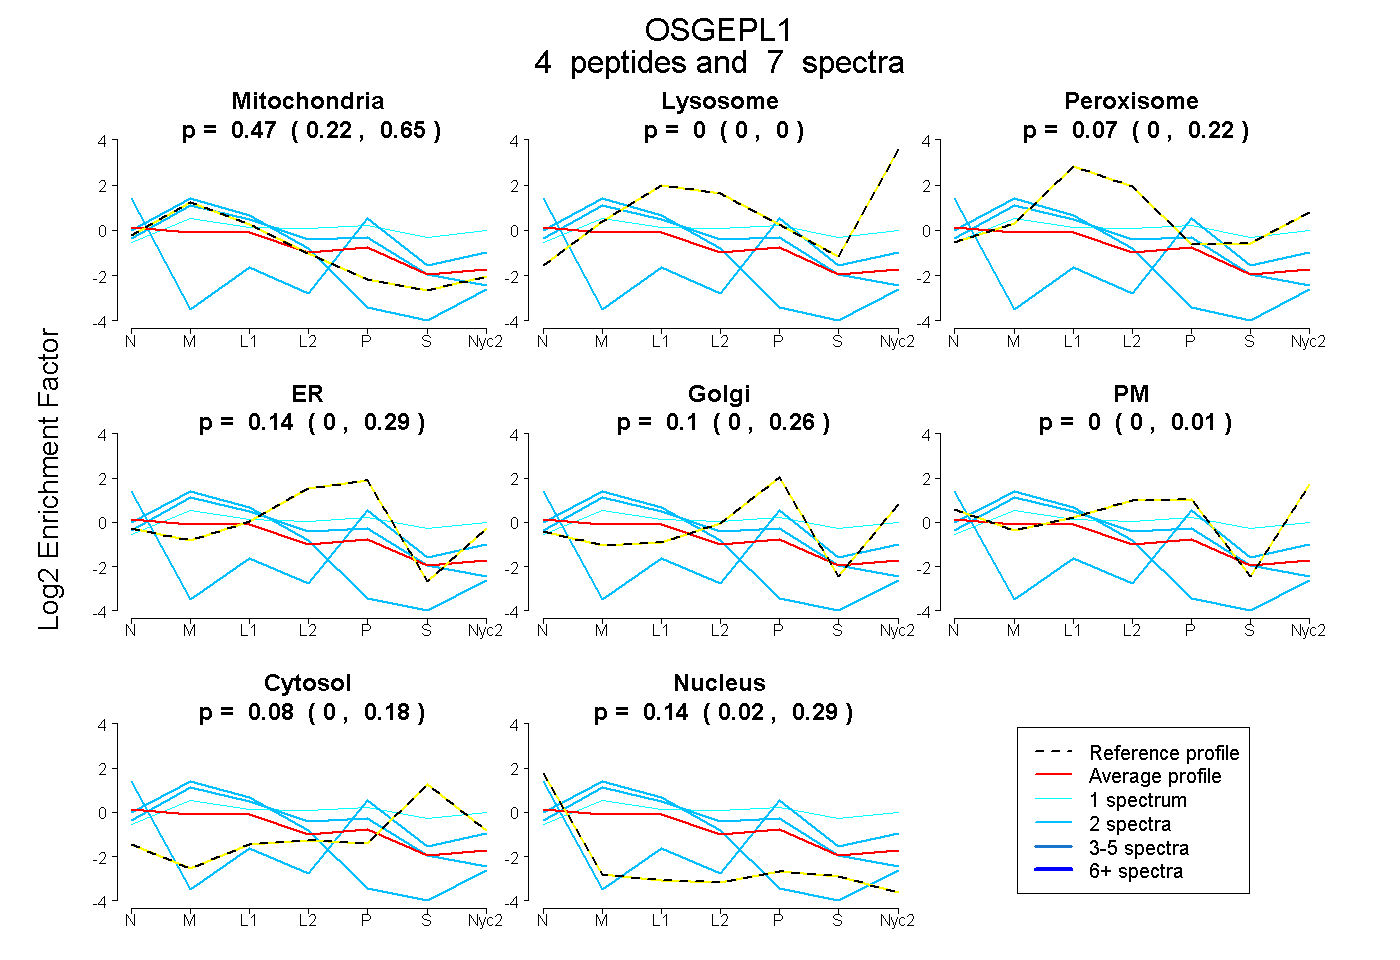
0.220 | 0.647
0.000 | 0.000
0.000 | 0.222
0.000 | 0.291
0.000 | 0.255
0.000 | 0.006
0.000 | 0.176
0.022 | 0.287
| Plot | Mito | Lyso | Perox | ER | Golgi | PM | Cytosol | Nucleus | |||||
| Expt A |
4 peptides |
7 spectra |
|
0.475 0.220 | 0.647 |
0.000 0.000 | 0.000 |
0.065 0.000 | 0.222 |
0.138 0.000 | 0.291 |
0.096 0.000 | 0.255 |
0.000 0.000 | 0.006 |
0.081 0.000 | 0.176 |
0.144 0.022 | 0.287 |
| 2 spectra, LMLSK | 0.000 | 0.000 | 0.000 | 0.000 | 0.408 | 0.000 | 0.138 | 0.454 | ||
| 2 spectra, AGLGILHDVEDIR | 1.000 | 0.000 | 0.000 | 0.000 | 0.000 | 0.000 | 0.000 | 0.000 | ||
| 2 spectra, TGGIVPPVAQQLHR | 0.711 | 0.000 | 0.000 | 0.285 | 0.000 | 0.000 | 0.004 | 0.000 | ||
| 1 spectrum, AILFCQQK | 0.182 | 0.049 | 0.299 | 0.000 | 0.262 | 0.000 | 0.208 | 0.000 |
| Plot | Lyso | Other | |||||||||||
| Expt C |
4 peptides |
8 spectra |
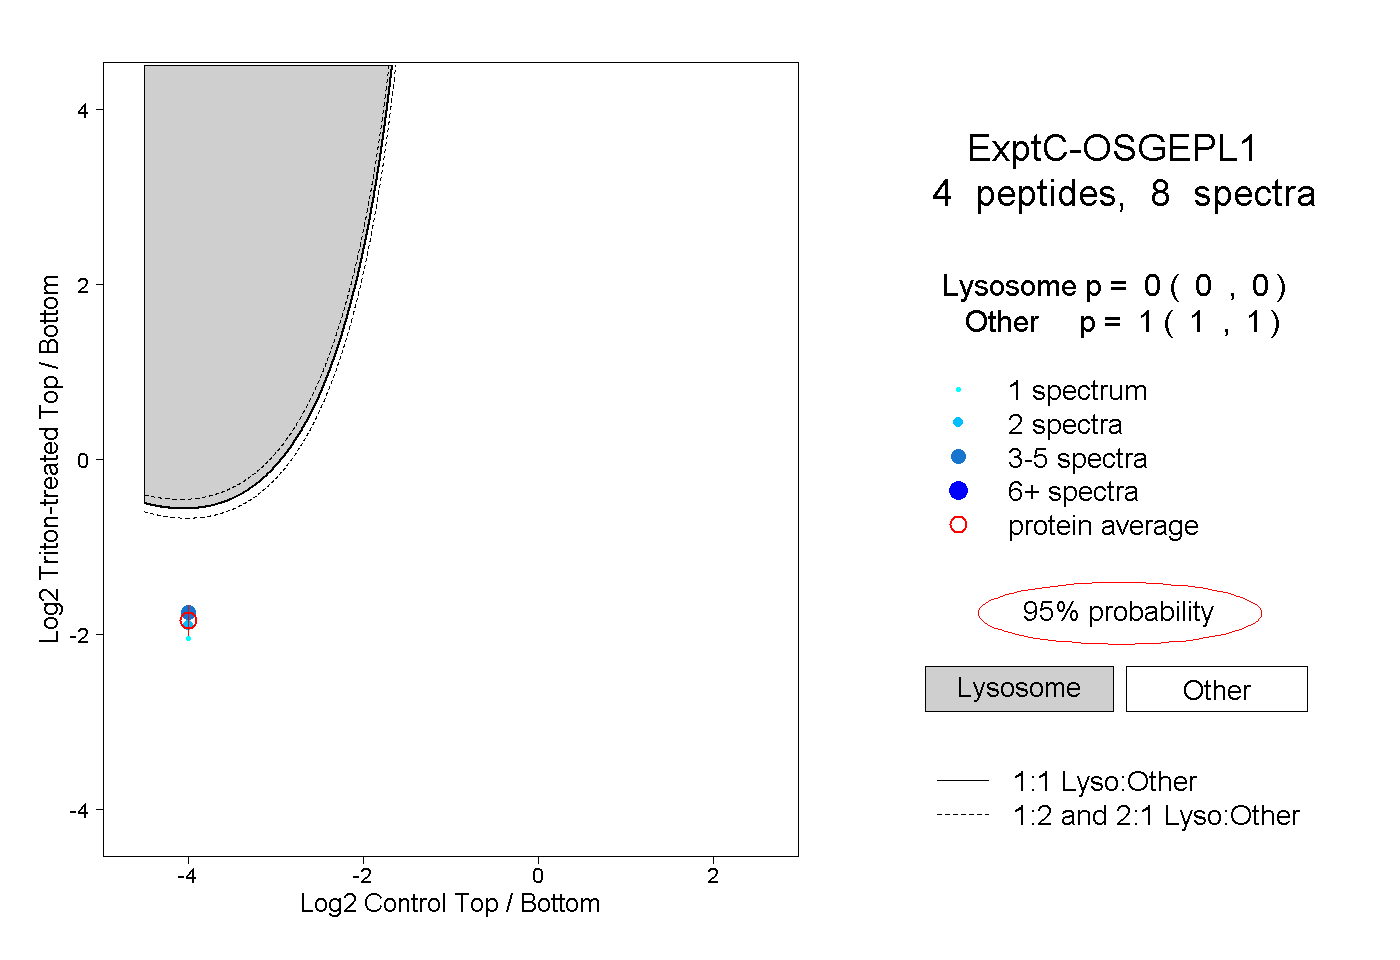 |
0.000 0.000 | 0.000 |
1.000 1.000 | 1.000 |