 3
3peptides
spectra
0.000 | 0.000
0.086 | 0.149
0.168 | 0.228
0.000 | 0.000
0.000 | 0.000
0.450 | 0.526
0.165 | 0.205
0.000 | 0.000
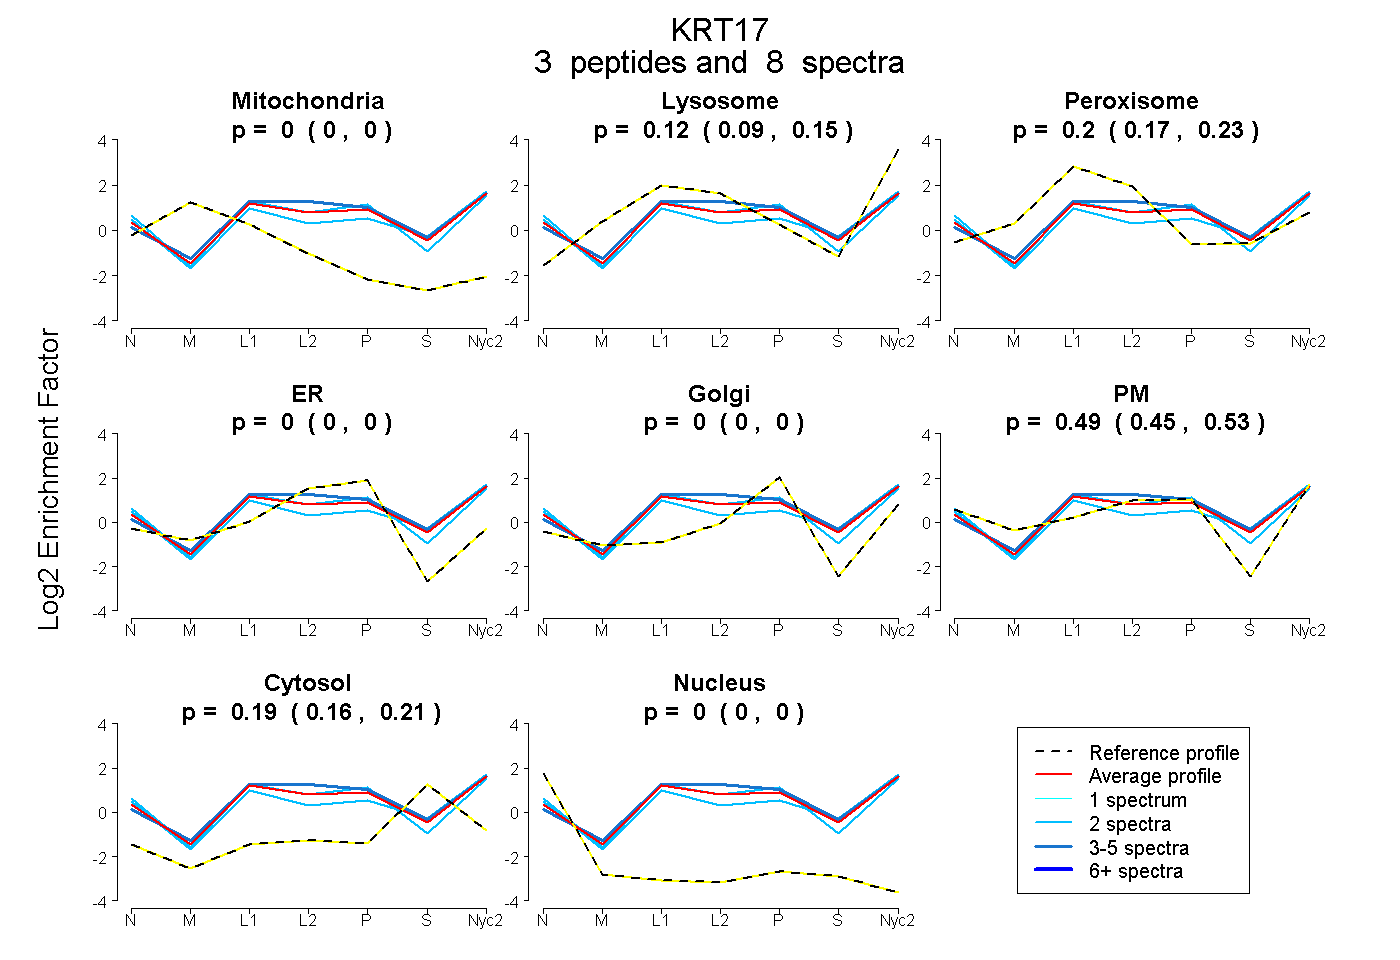
| Plot | Mito | Lyso | Perox | ER | Golgi | PM | Cytosol | Nucleus | |||||
| Expt A |
3 peptides |
8 spectra |
|
0.000 0.000 | 0.000 |
0.122 0.086 | 0.149 |
0.199 0.168 | 0.228 |
0.000 0.000 | 0.000 |
0.000 0.000 | 0.000 |
0.491 0.450 | 0.526 |
0.188 0.165 | 0.205 |
0.000 0.000 | 0.000 |
| 4 spectra, NHEEEMNALR | 0.000 | 0.174 | 0.247 | 0.029 | 0.000 | 0.395 | 0.155 | 0.000 | ||
| 2 spectra, ATMQNLNDR | 0.000 | 0.151 | 0.118 | 0.000 | 0.000 | 0.457 | 0.274 | 0.000 | ||
| 2 spectra, DAEDWFFSK | 0.000 | 0.001 | 0.219 | 0.000 | 0.000 | 0.655 | 0.125 | 0.000 |
| Plot | Mito | Lyso or Perox | ER | Golgi | PM | Cytosol | Nucleus | ||||||
| Expt B |
1 peptide |
2 spectra |
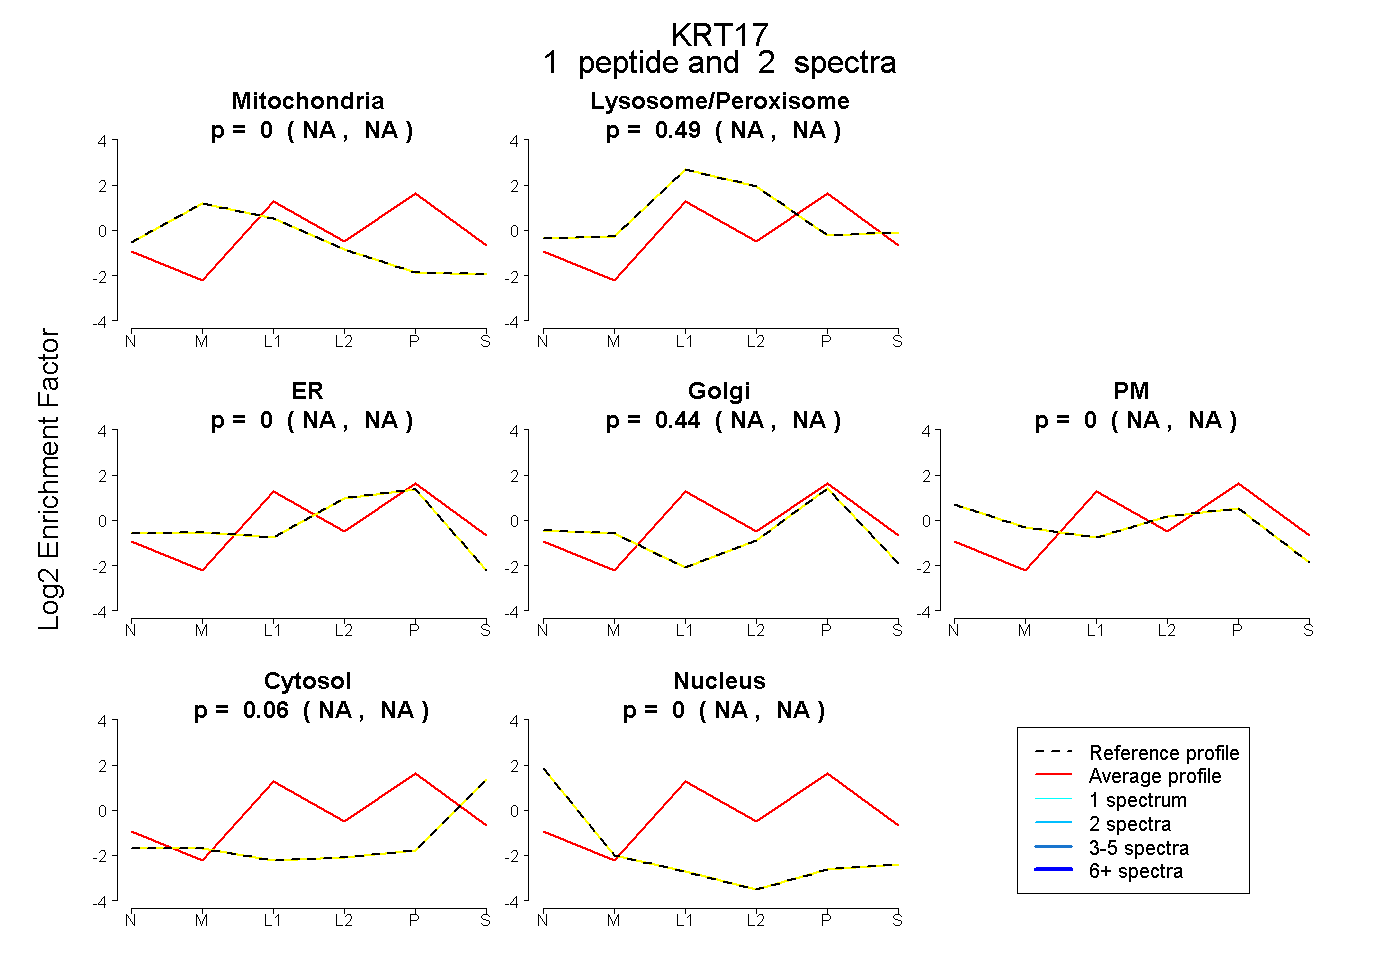 |
0.000 NA | NA |
0.491 NA | NA |
0.000 NA | NA |
0.445 NA | NA |
0.000 NA | NA |
0.064 NA | NA |
0.000 NA | NA |
|||
| Plot | Lyso | Other | |||||||||||
| Expt C |
3 peptides |
9 spectra |
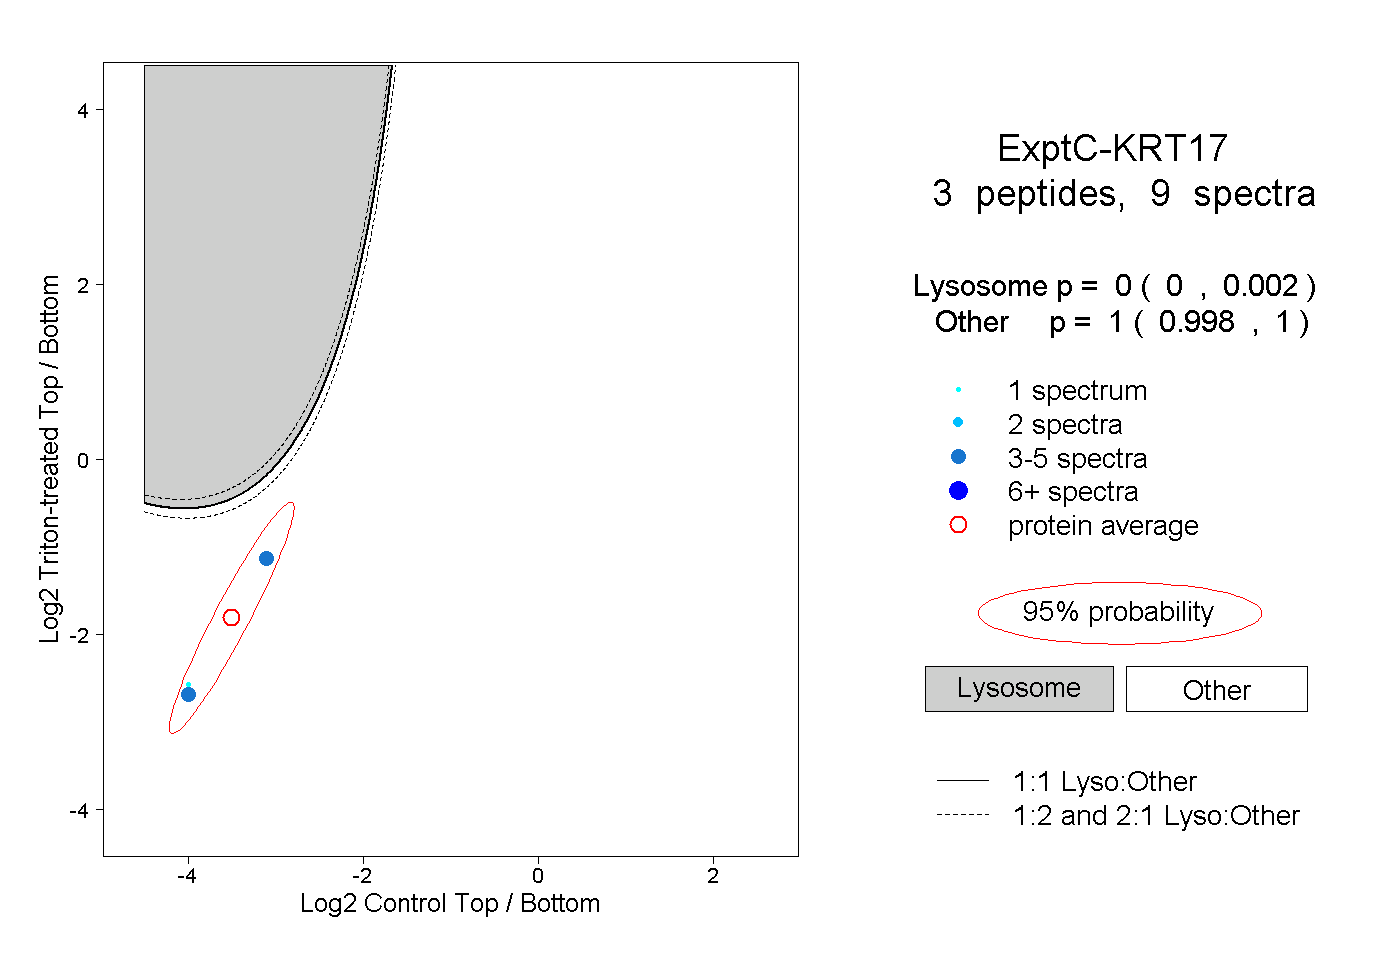 |
0.000 0.000 | 0.002 |
1.000 0.998 | 1.000 |
||||||||
| Plot | Lyso | Other | |||||||||||
| Expt D |
2 peptides |
10 spectra |
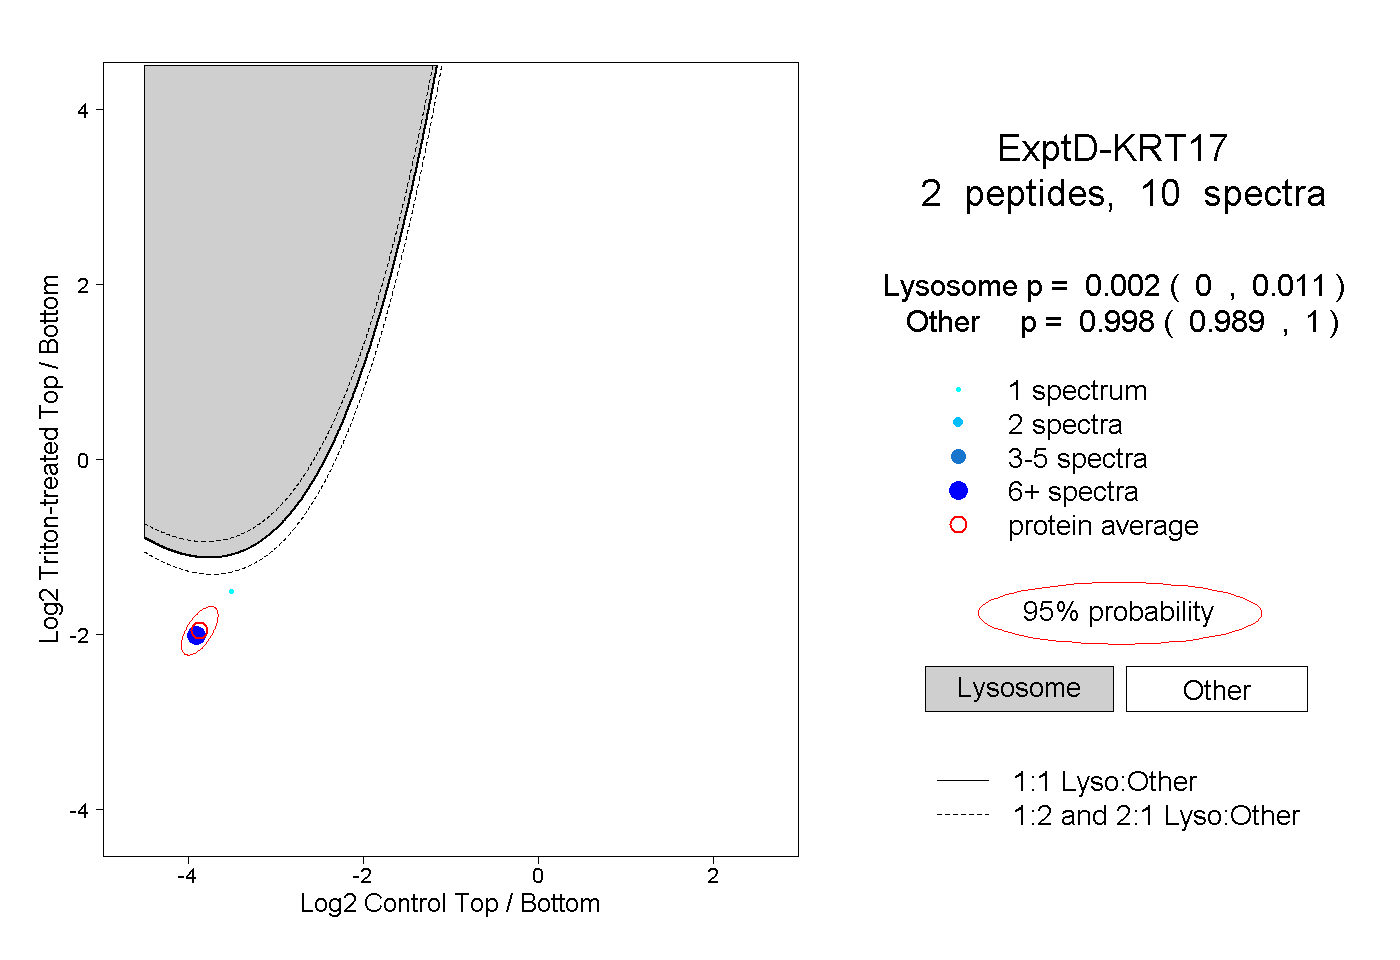 |
0.002 0.000 | 0.011 |
0.998 0.989 | 1.000 |