 4
4peptides
spectra
0.000 | 0.000
0.000 | 0.000
0.000 | 0.000
0.000 | 0.000
0.000 | 0.046
0.132 | 0.218
0.777 | 0.818
0.000 | 0.003
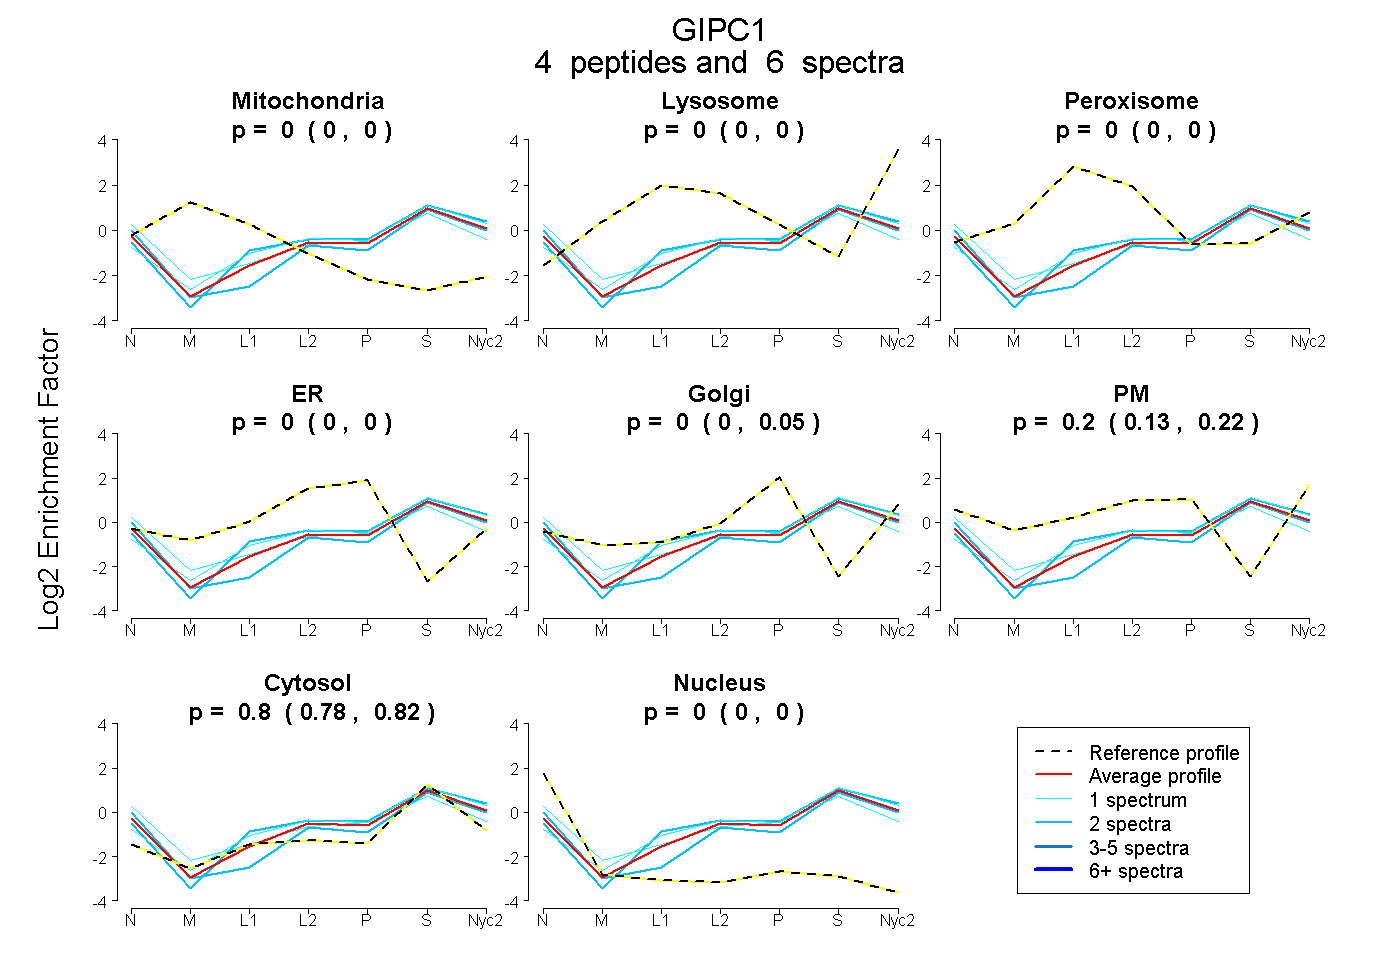
| Plot | Mito | Lyso | Perox | ER | Golgi | PM | Cytosol | Nucleus | |||||
| Expt A |
4 peptides |
6 spectra |
|
0.000 0.000 | 0.000 |
0.000 0.000 | 0.000 |
0.000 0.000 | 0.000 |
0.000 0.000 | 0.000 |
0.000 0.000 | 0.046 |
0.198 0.132 | 0.218 |
0.802 0.777 | 0.818 |
0.000 0.000 | 0.003 |
| 2 spectra, NPDELAEALDER | 0.000 | 0.020 | 0.000 | 0.000 | 0.000 | 0.189 | 0.791 | 0.000 | ||
| 1 spectrum, IAEAFR | 0.000 | 0.000 | 0.000 | 0.000 | 0.000 | 0.247 | 0.686 | 0.067 | ||
| 1 spectrum, VDDLLESYMGIR | 0.000 | 0.077 | 0.000 | 0.000 | 0.000 | 0.151 | 0.772 | 0.000 | ||
| 2 spectra, DTELAATMVELGK | 0.000 | 0.000 | 0.000 | 0.000 | 0.005 | 0.132 | 0.788 | 0.076 |
| Plot | Lyso | Other | |||||||||||
| Expt C |
4 peptides |
5 spectra |
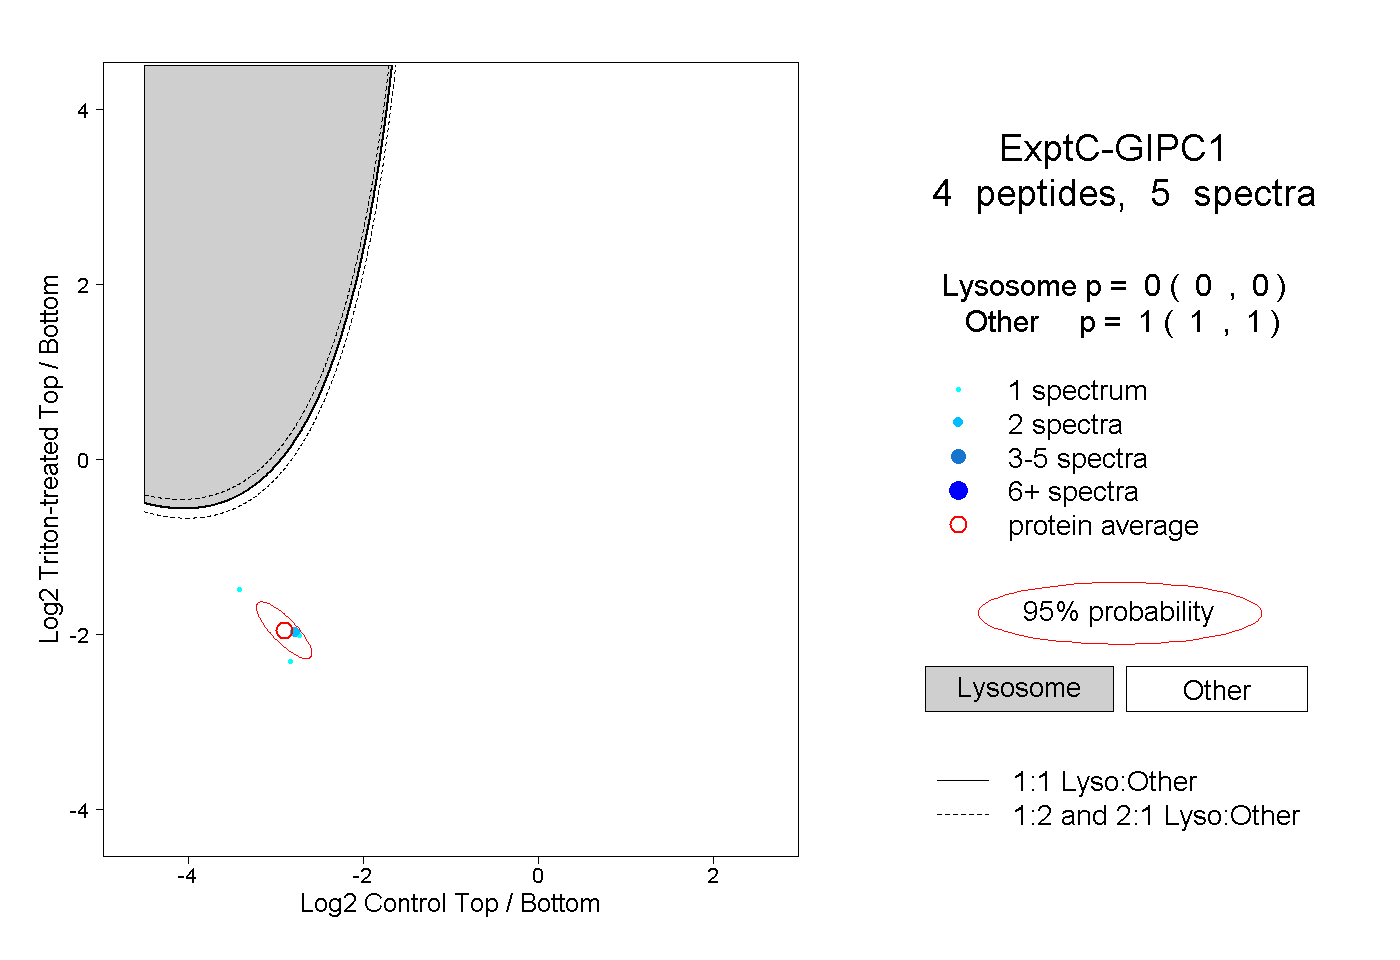 |
0.000 0.000 | 0.000 |
1.000 1.000 | 1.000 |
||||||||
| Plot | Lyso | Other | |||||||||||
| Expt D |
1 peptide |
3 spectra |
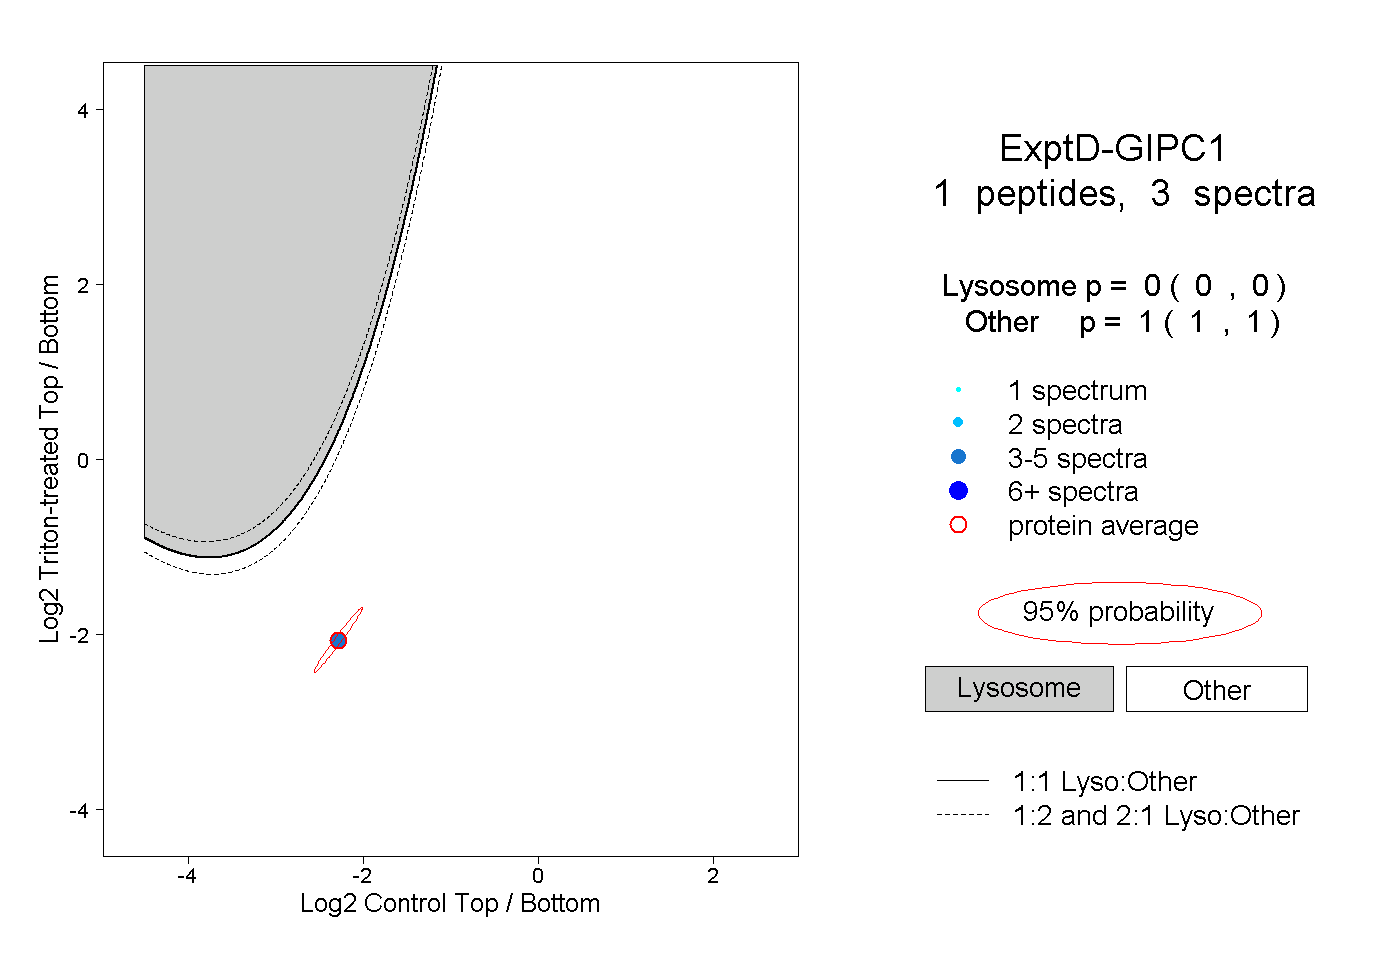 |
0.000 0.000 | 0.000 |
1.000 1.000 | 1.000 |