5
5peptides
spectra
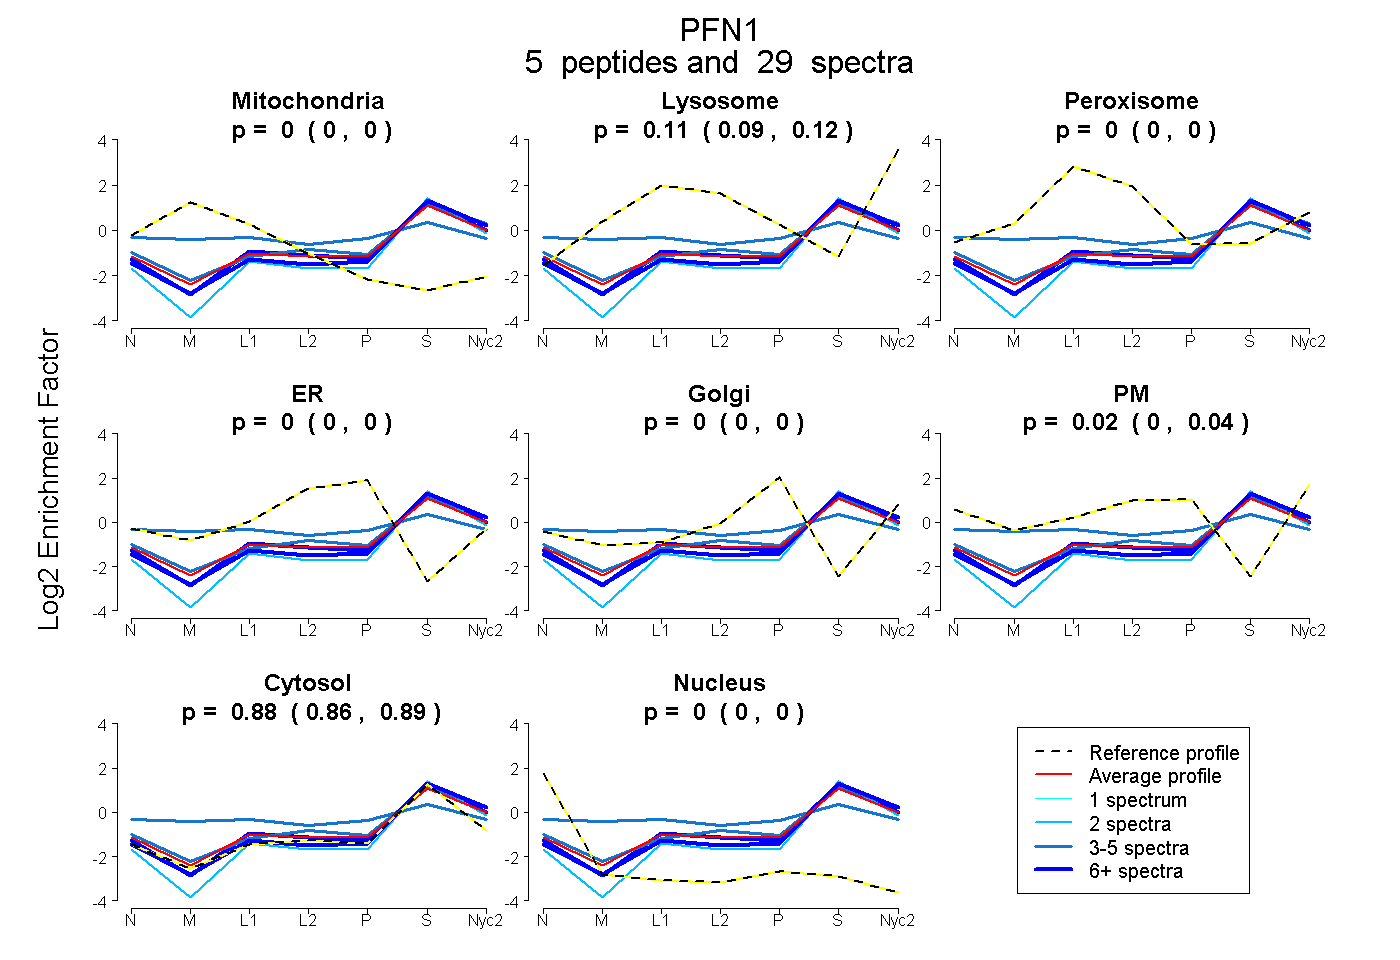
0.000 | 0.000
0.086 | 0.121
0.000 | 0.000
0.000 | 0.000
0.000 | 0.000
0.000 | 0.035
0.863 | 0.889
0.000 | 0.000
7peptides
spectra
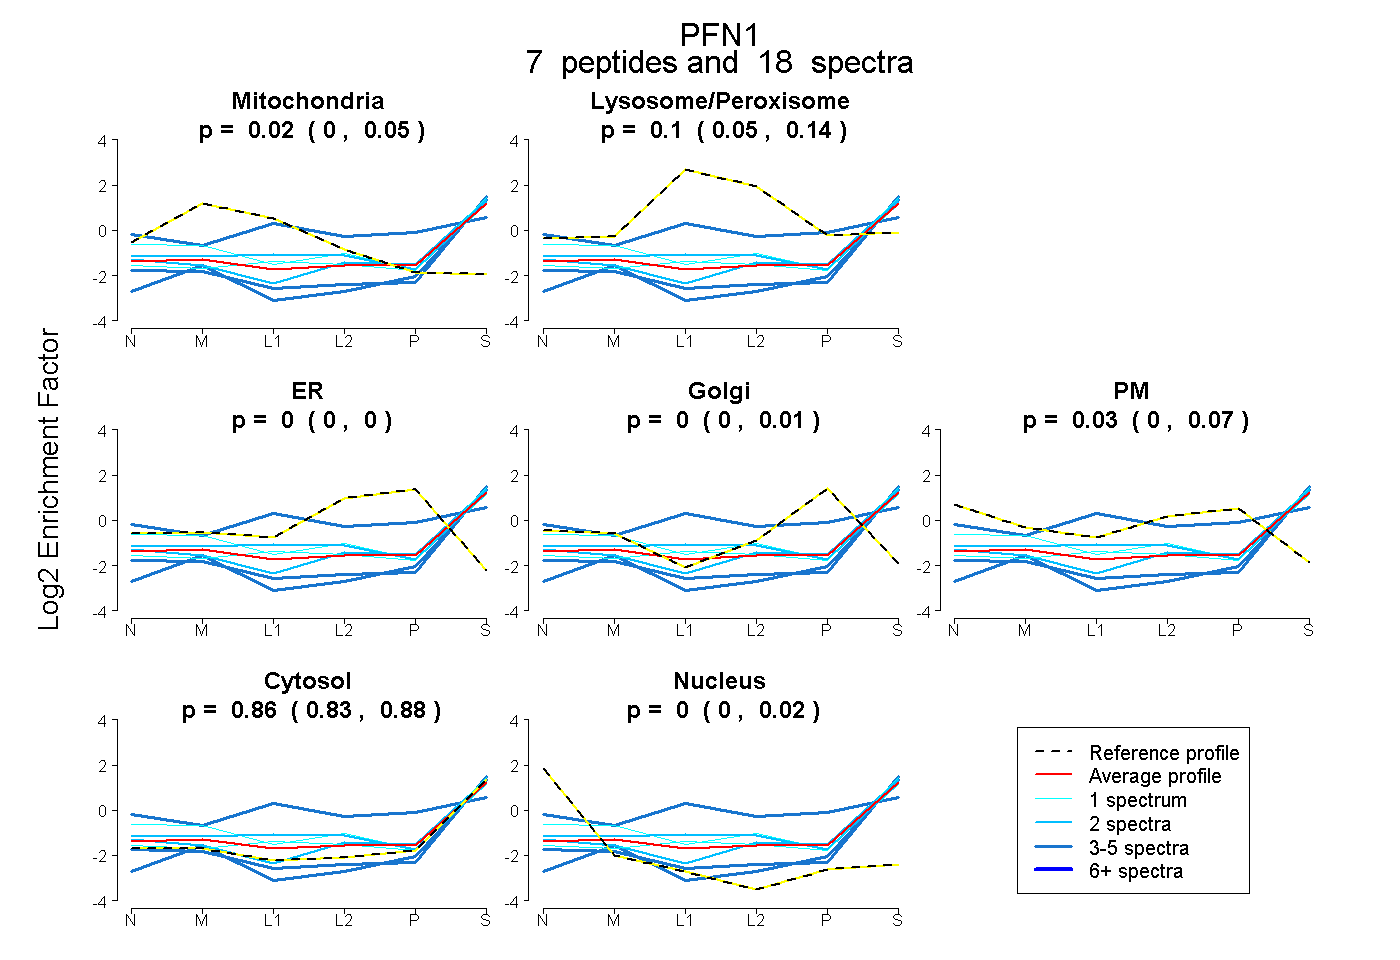
0.000 | 0.047
0.049 | 0.138
0.000 | 0.000
0.000 | 0.010
0.000 | 0.068
0.826 | 0.877
0.000 | 0.020