 5
5peptides
spectra
0.000 | 0.000
0.086 | 0.121
0.000 | 0.000
0.000 | 0.000
0.000 | 0.000
0.000 | 0.035
0.863 | 0.889
0.000 | 0.000
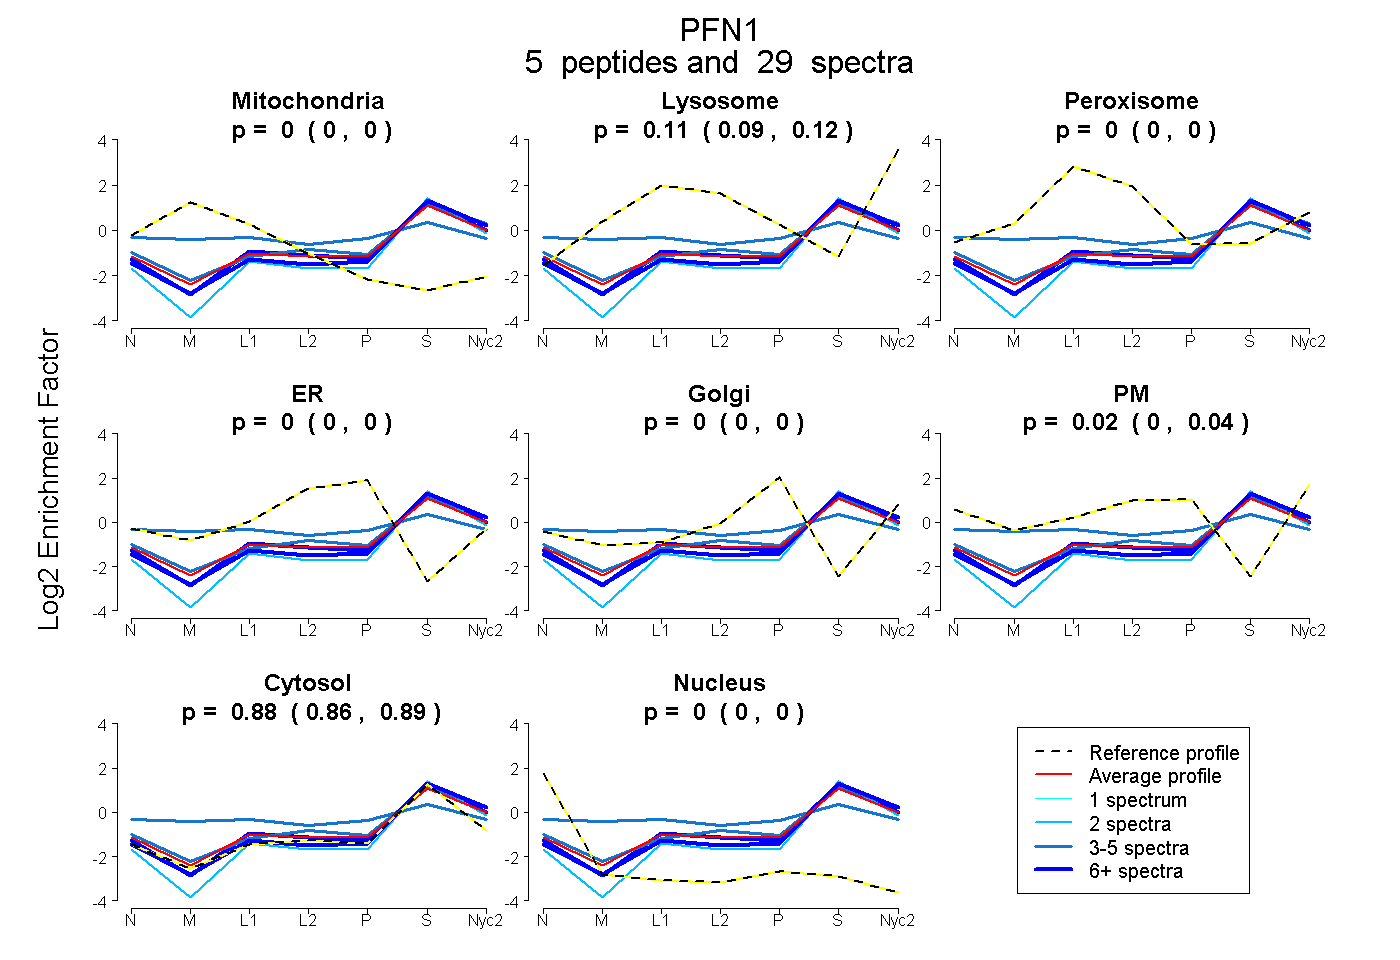
| Plot | Mito | Lyso | Perox | ER | Golgi | PM | Cytosol | Nucleus | |||||
| Expt A |
5 peptides |
29 spectra |
|
0.000 0.000 | 0.000 |
0.106 0.086 | 0.121 |
0.000 0.000 | 0.000 |
0.000 0.000 | 0.000 |
0.000 0.000 | 0.000 |
0.017 0.000 | 0.035 |
0.877 0.863 | 0.889 |
0.000 0.000 | 0.000 |
| 4 spectra, CYEMASHLR | 0.140 | 0.000 | 0.177 | 0.000 | 0.079 | 0.117 | 0.487 | 0.000 | ||
| 2 spectra, EGVHGGLINK | 0.000 | 0.000 | 0.000 | 0.000 | 0.000 | 0.000 | 1.000 | 0.000 | ||
| 9 spectra, DSLLQDGEFTMDLR | 0.000 | 0.091 | 0.000 | 0.000 | 0.000 | 0.000 | 0.909 | 0.000 | ||
| 11 spectra, TLVLLMGK | 0.000 | 0.062 | 0.000 | 0.000 | 0.000 | 0.000 | 0.938 | 0.000 | ||
| 3 spectra, STGGAPTFNVTVTMTAK | 0.000 | 0.125 | 0.000 | 0.000 | 0.000 | 0.044 | 0.831 | 0.000 |
| Plot | Mito | Lyso or Perox | ER | Golgi | PM | Cytosol | Nucleus | ||||||
| Expt B |
7 peptides |
18 spectra |
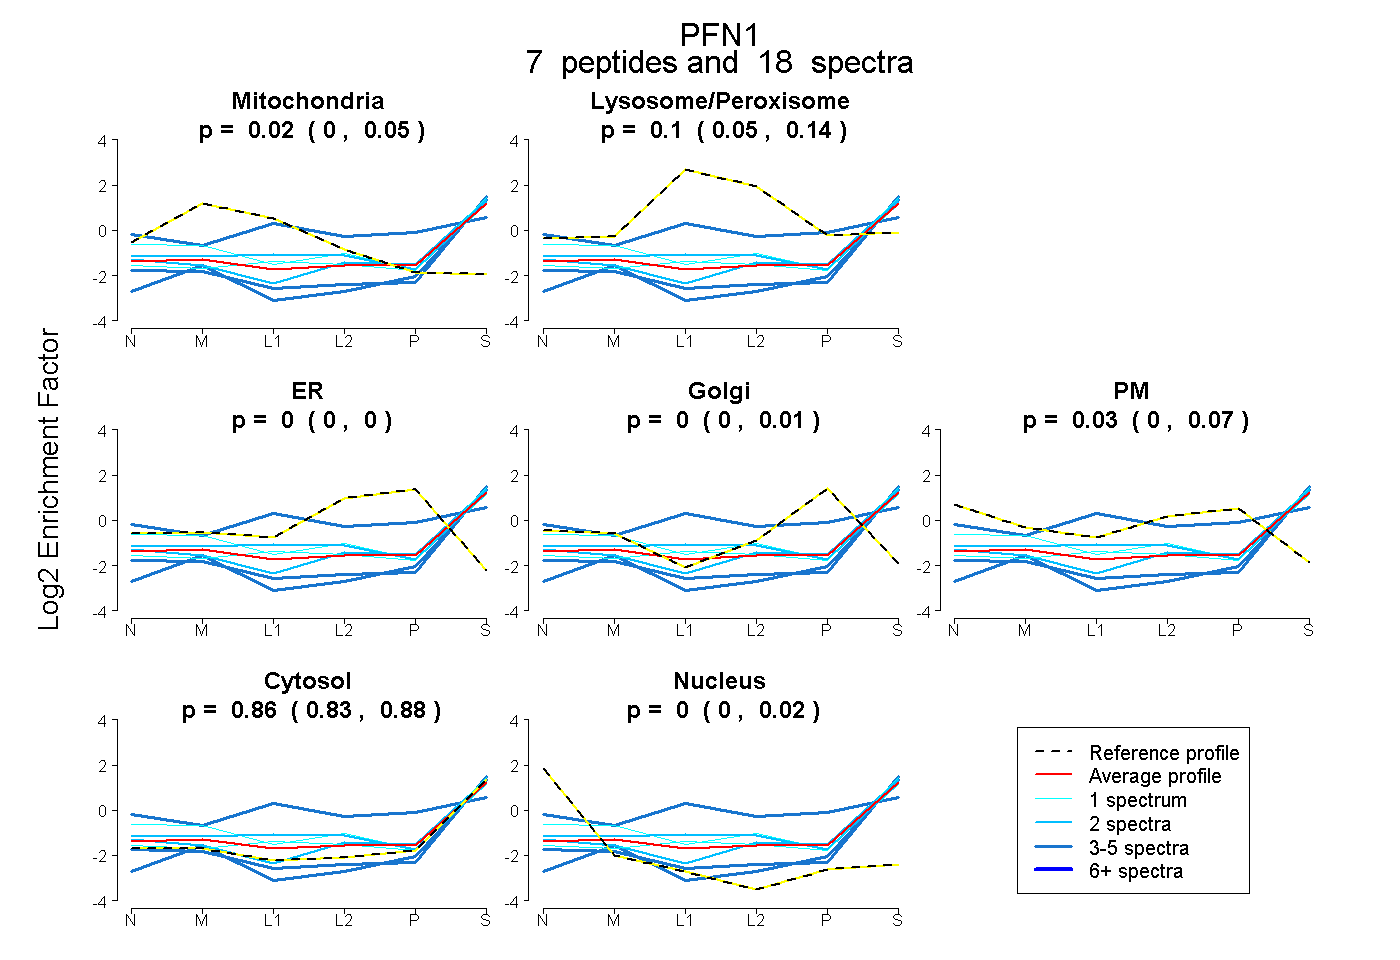 |
0.016 0.000 | 0.047 |
0.099 0.049 | 0.138 |
0.000 0.000 | 0.000 |
0.000 0.000 | 0.010 |
0.029 0.000 | 0.068 |
0.856 0.826 | 0.877 |
0.000 0.000 | 0.020 |
|||
| Plot | Lyso | Other | |||||||||||
| Expt C |
7 peptides |
54 spectra |
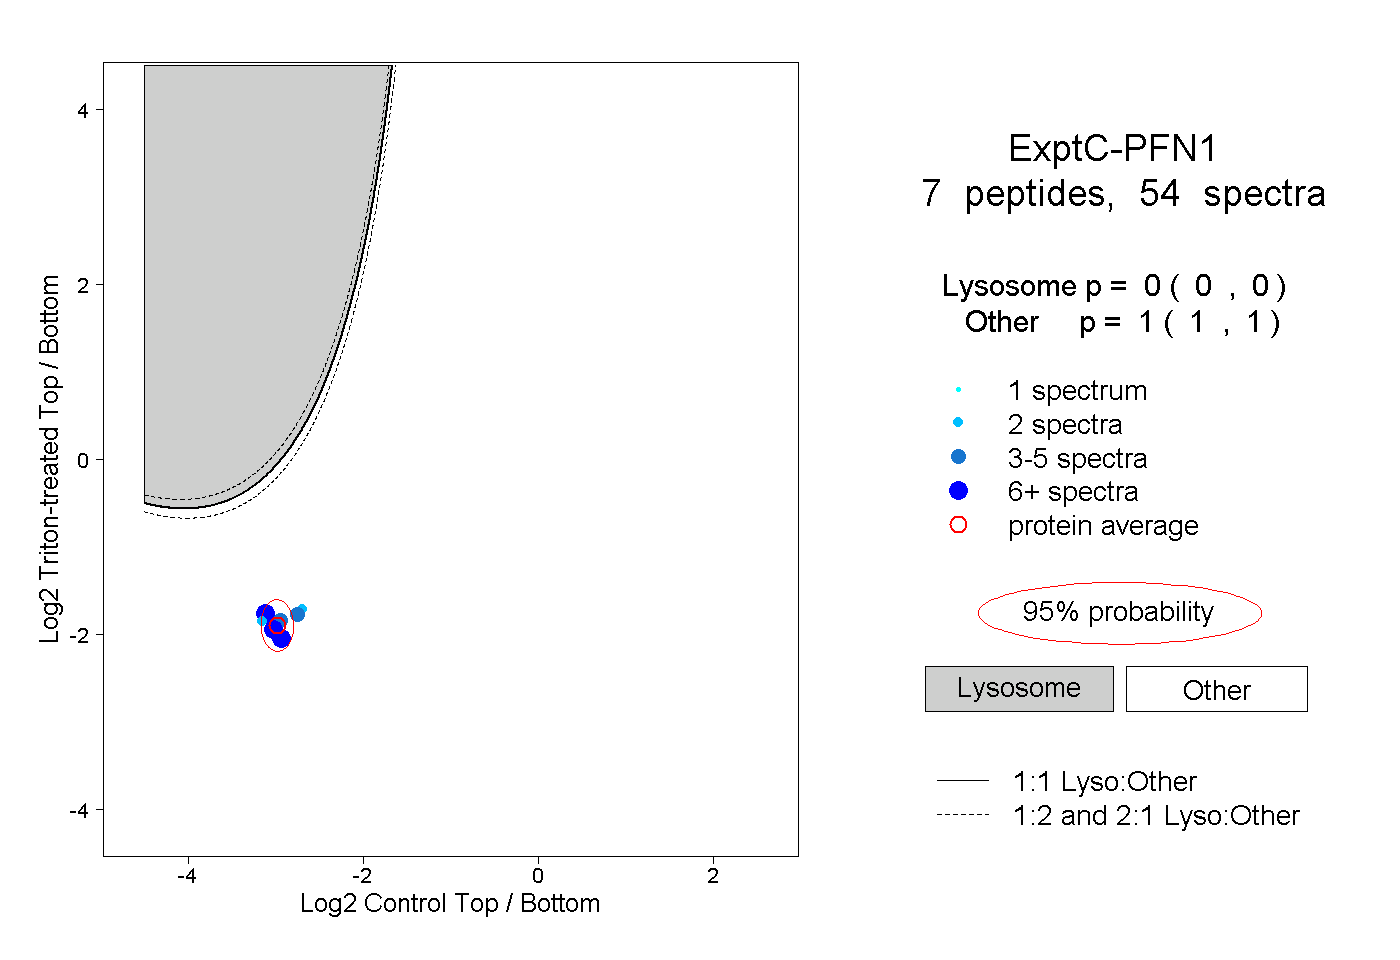 |
0.000 0.000 | 0.000 |
1.000 1.000 | 1.000 |
||||||||
| Plot | Lyso | Other | |||||||||||
| Expt D |
2 peptides |
3 spectra |
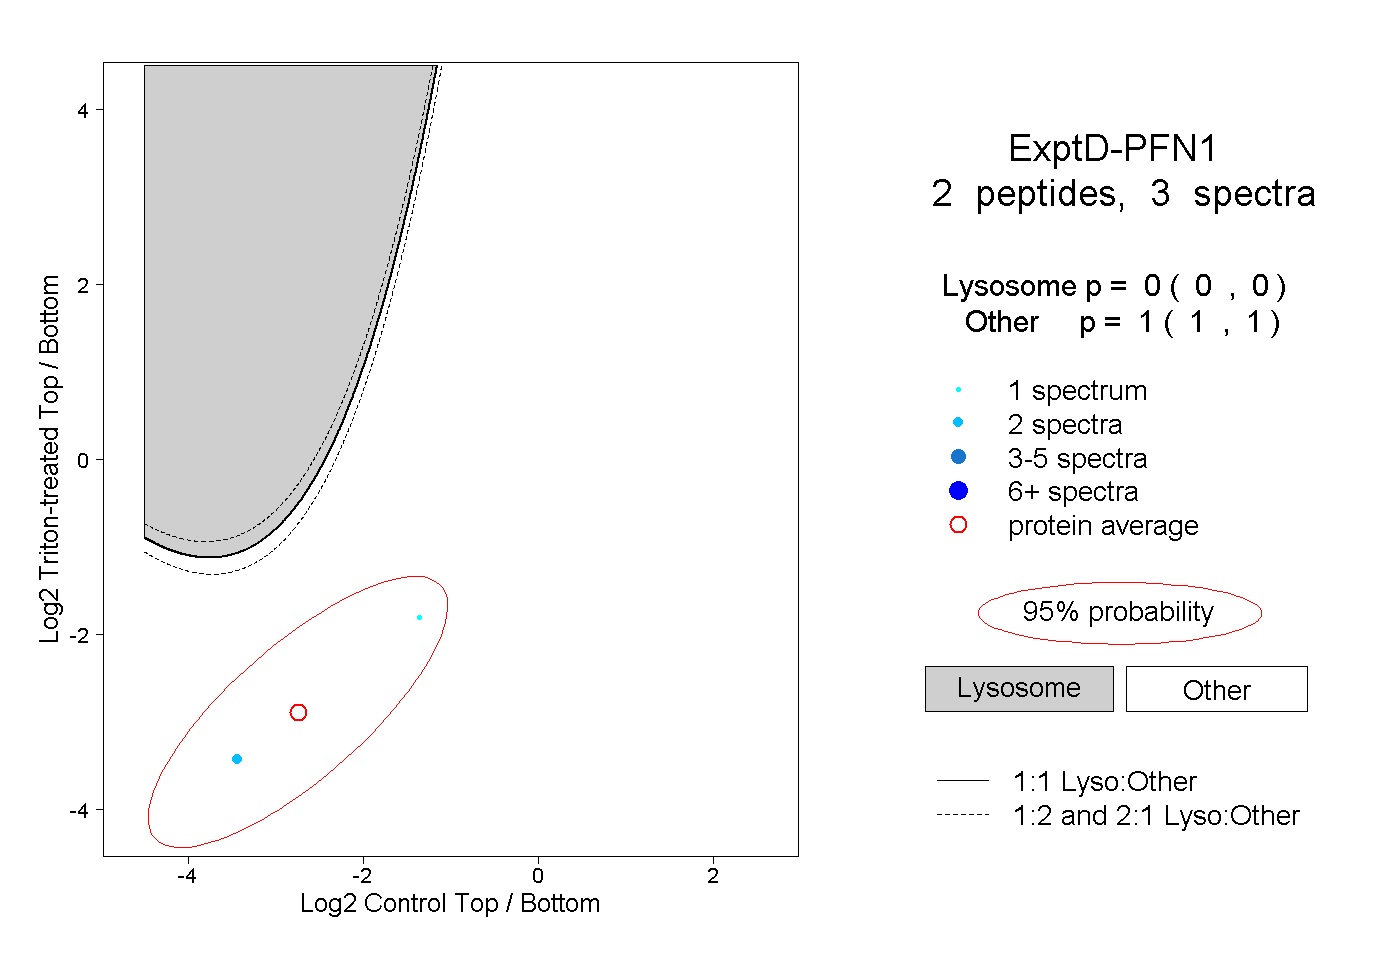 |
0.000 0.000 | 0.000 |
1.000 1.000 | 1.000 |