 3
3peptides
spectra
0.000 | 0.001
0.000 | 0.000
0.000 | 0.105
0.000 | 0.366
0.000 | 0.082
0.000 | 0.467
0.338 | 0.464
0.053 | 0.253
1peptide
spectra
NA | NA
NA | NA
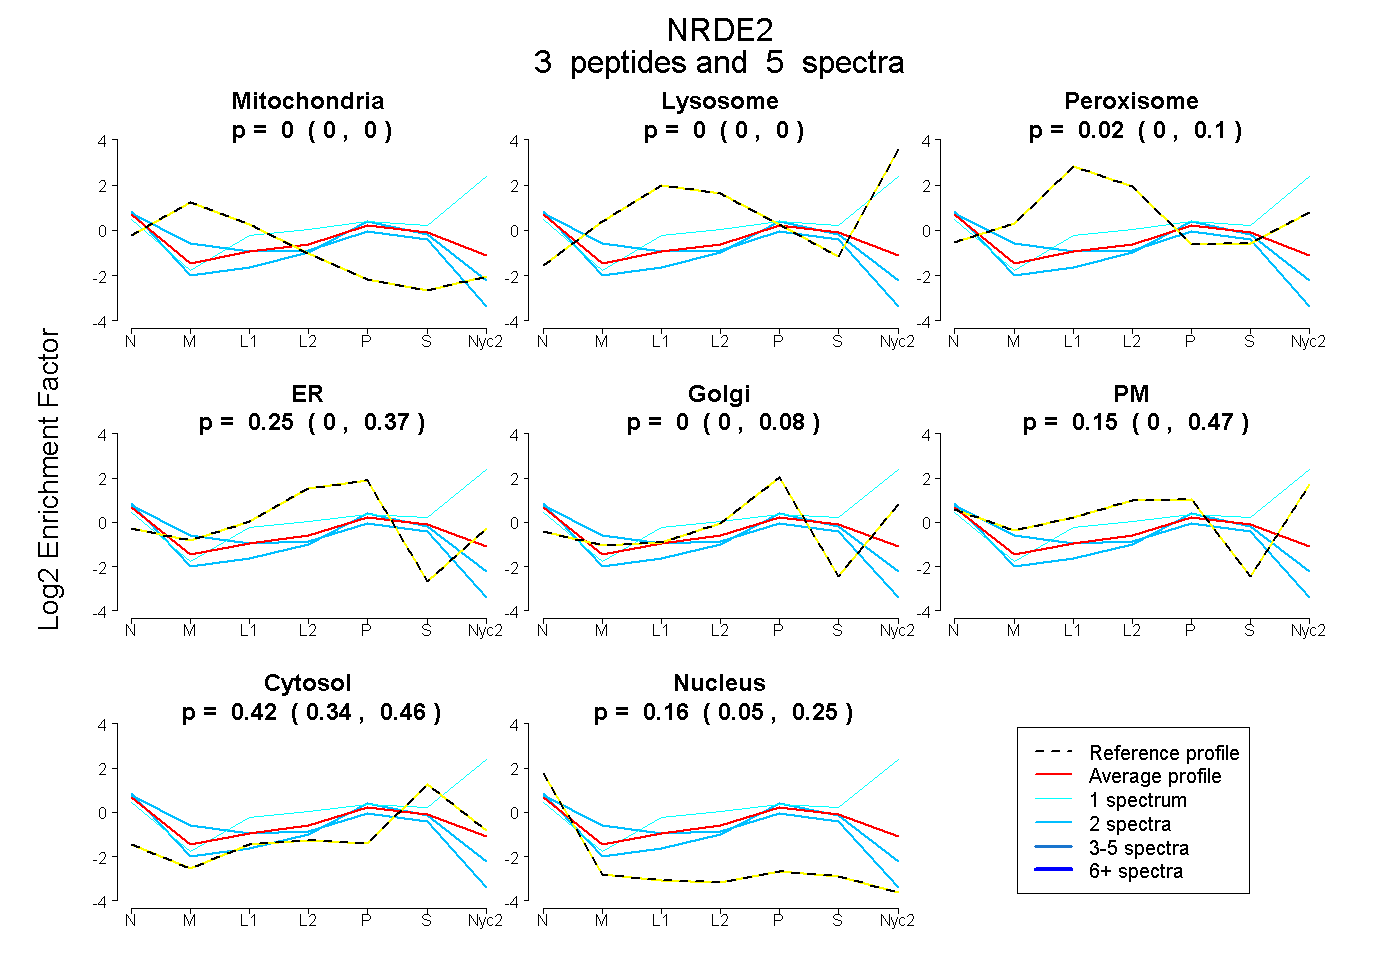
| Plot | Mito | Lyso | Perox | ER | Golgi | PM | Cytosol | Nucleus | |||||
| Expt A |
3 peptides |
5 spectra |
|
0.000 0.000 | 0.001 |
0.000 0.000 | 0.000 |
0.024 0.000 | 0.105 |
0.246 0.000 | 0.366 |
0.000 0.000 | 0.082 |
0.147 0.000 | 0.467 |
0.423 0.338 | 0.464 |
0.161 0.053 | 0.253 |
||
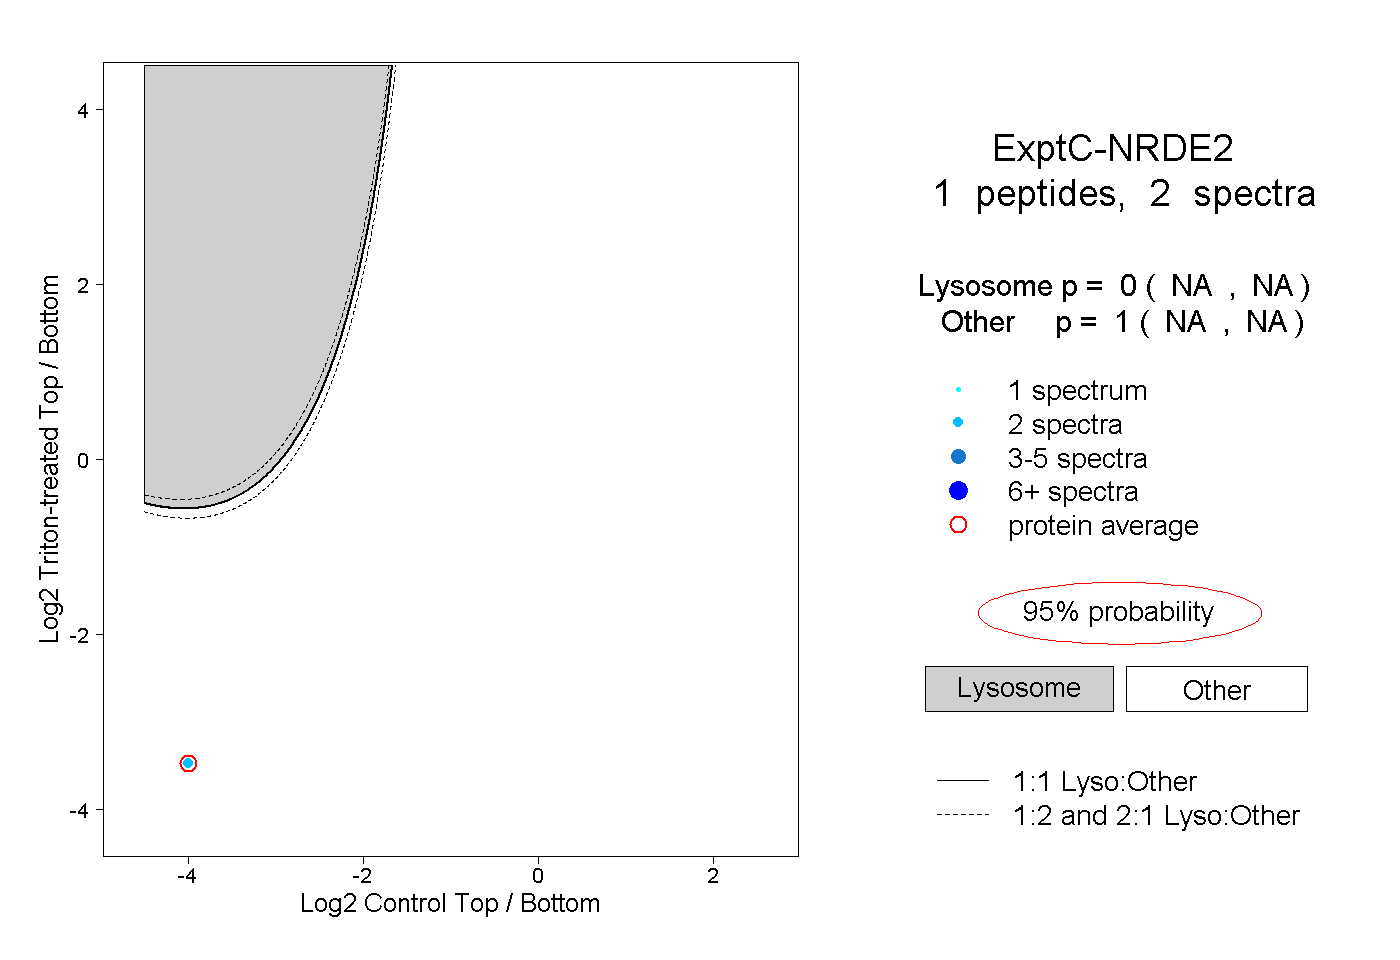
| Plot | Lyso | Other | |||||||||||
| Expt C |
1 peptide |
2 spectra |
|
0.000 NA | NA |
1.000 NA | NA |