10
10peptides
spectra
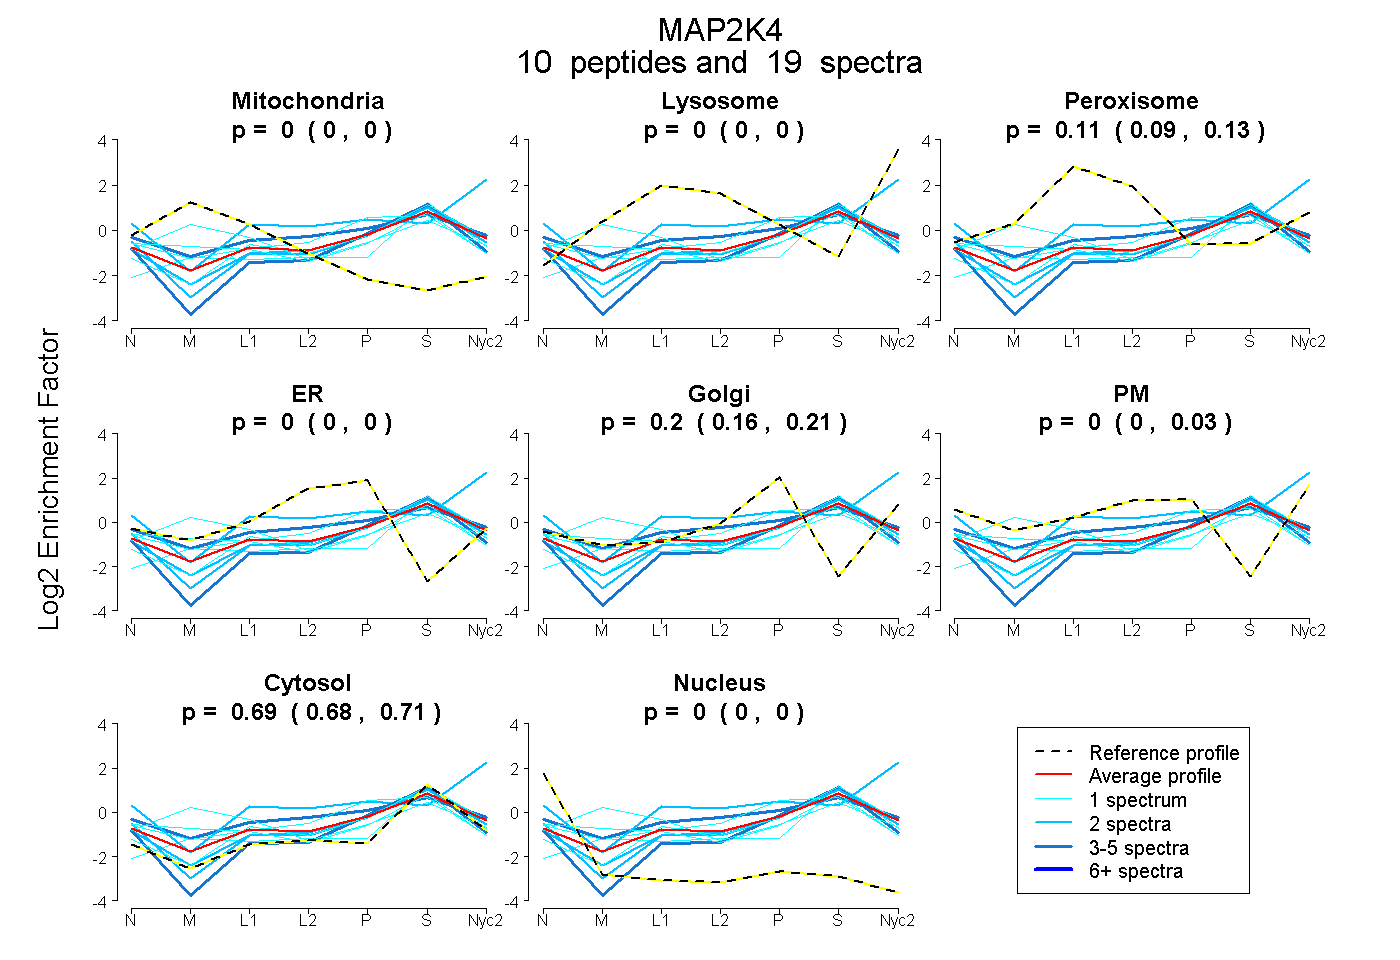
0.000 | 0.000
0.000 | 0.000
0.089 | 0.125
0.000 | 0.000
0.162 | 0.207
0.000 | 0.027
0.677 | 0.708
0.000 | 0.000
4peptides
spectra
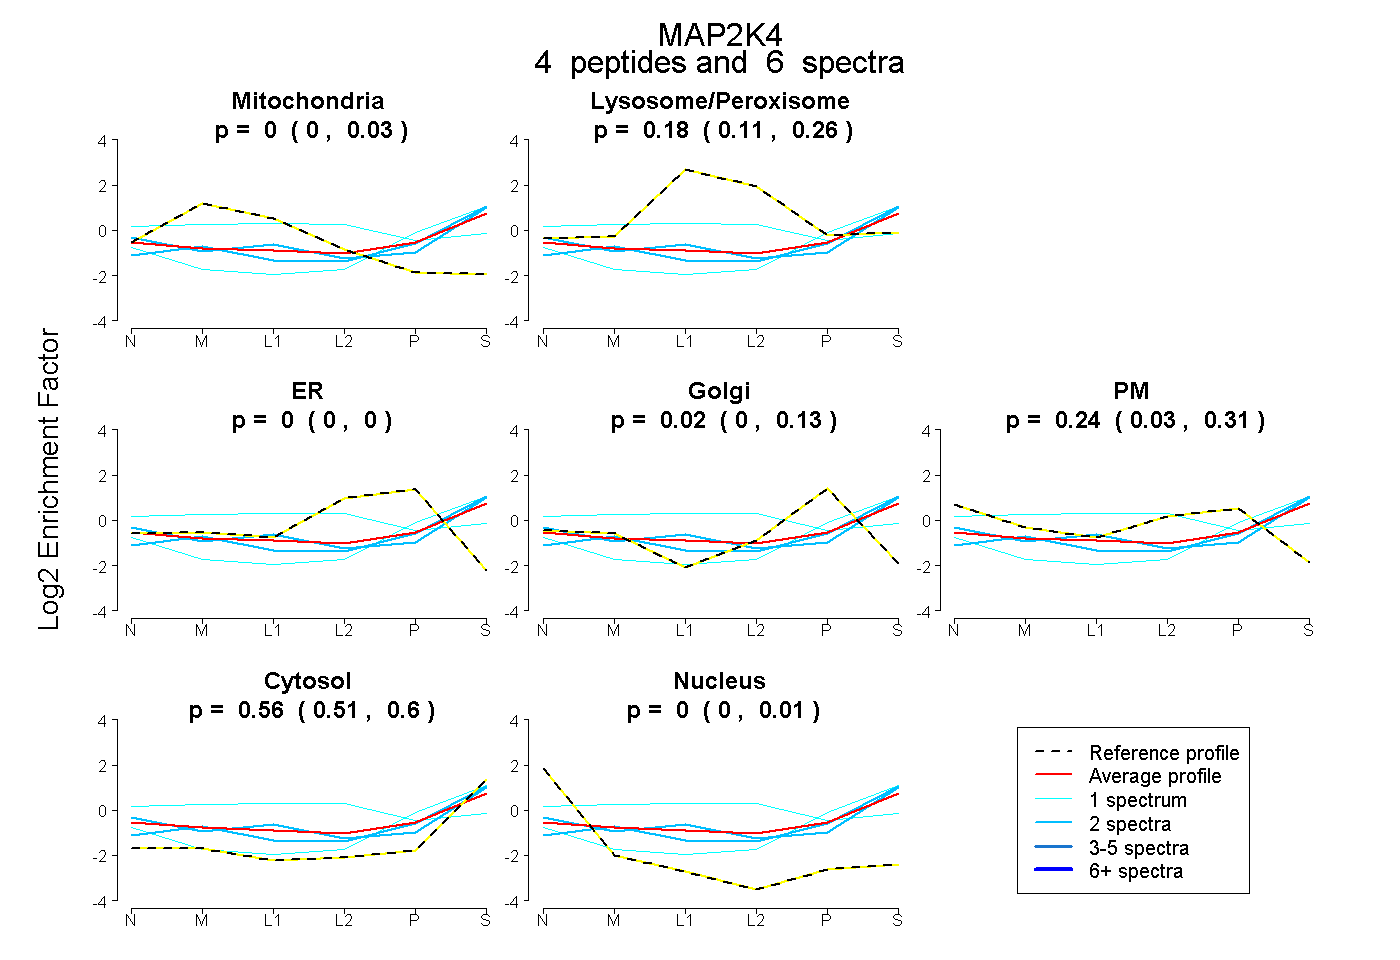
0.000 | 0.030
0.107 | 0.262
0.000 | 0.000
0.000 | 0.127
0.035 | 0.308
0.506 | 0.598
0.000 | 0.006
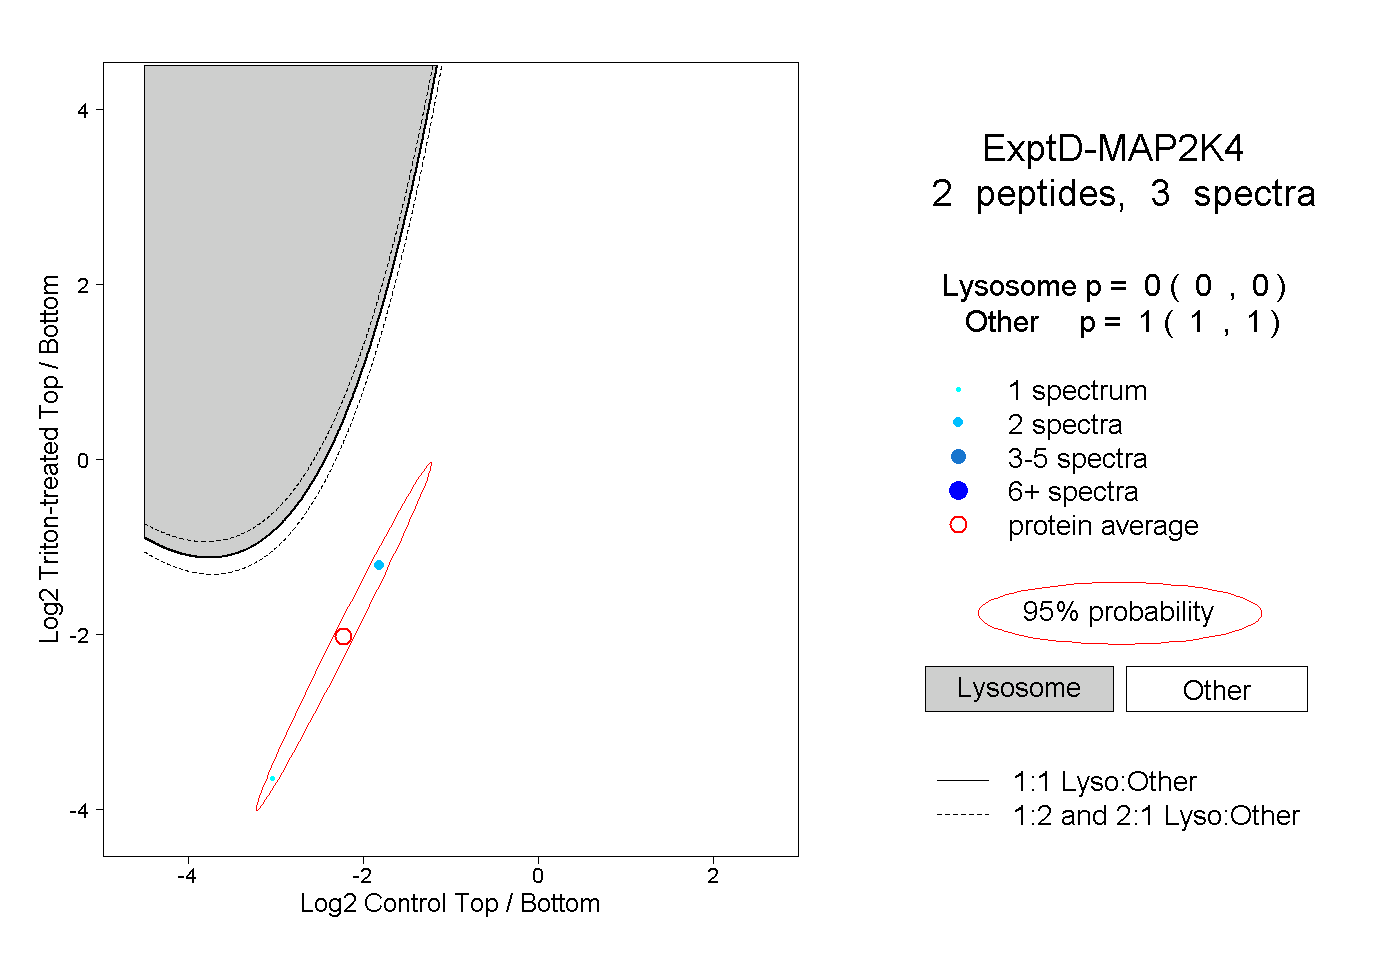
11peptides
spectra
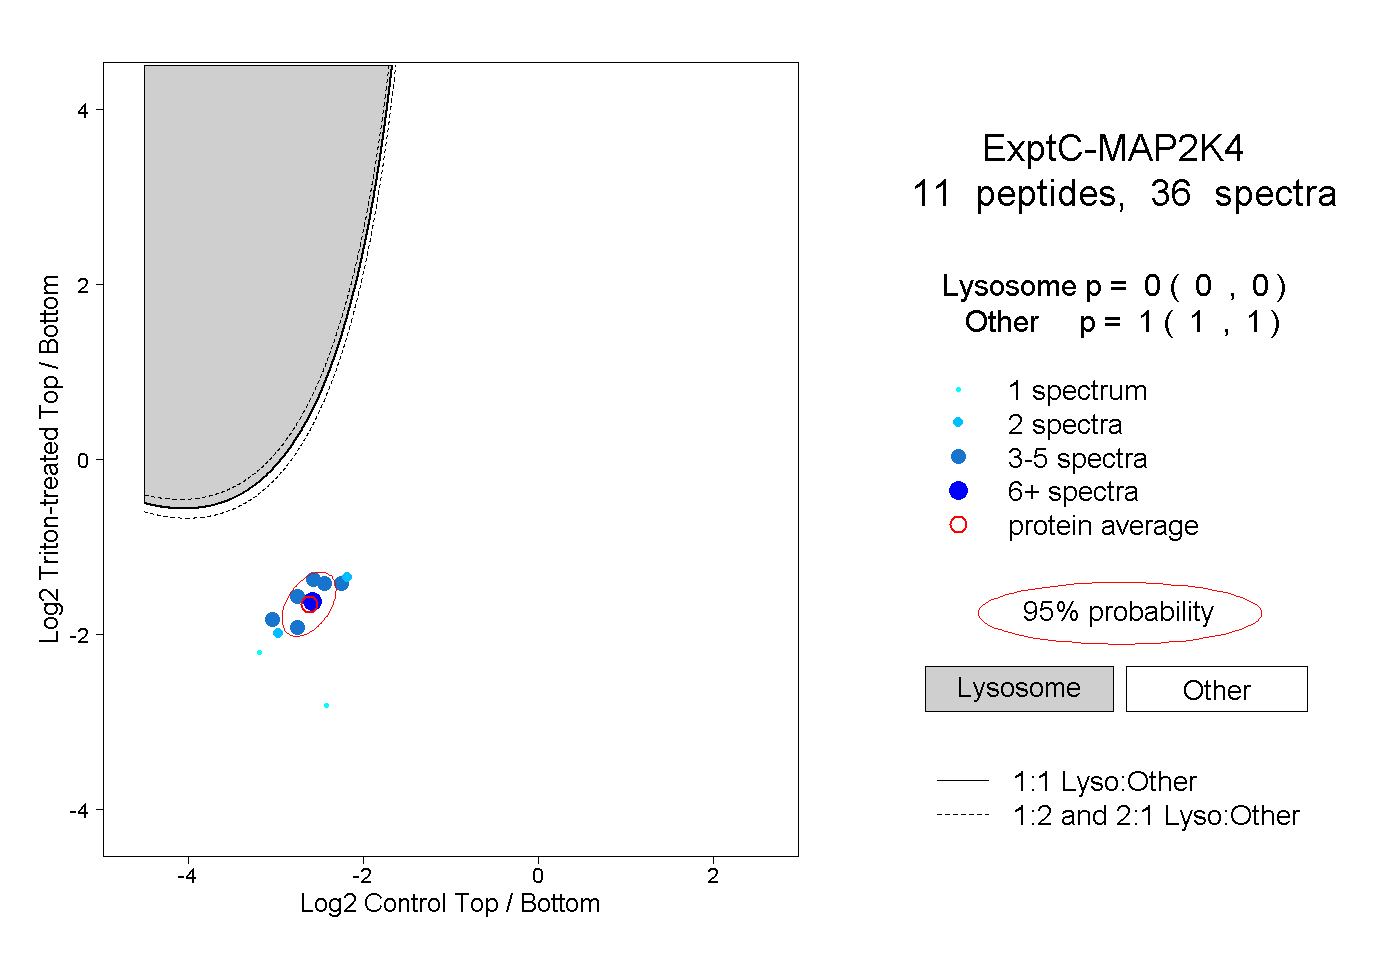
0.000 | 0.000
1.000 | 1.000