11
11peptides
spectra
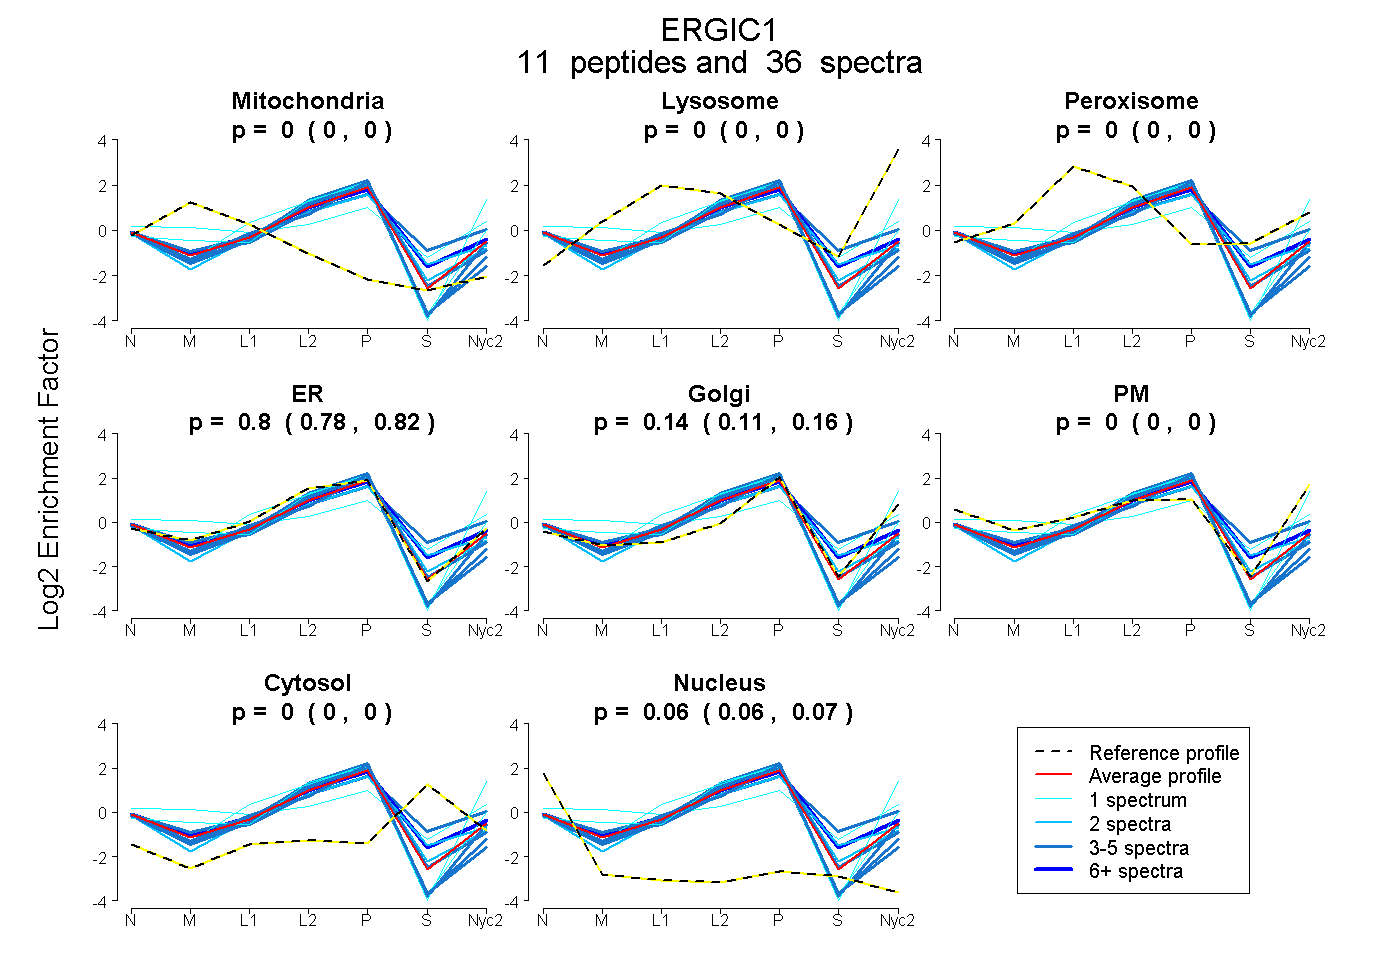
0.000 | 0.000
0.000 | 0.000
0.000 | 0.000
0.776 | 0.817
0.111 | 0.159
0.000 | 0.000
0.000 | 0.005
0.057 | 0.069
6peptides
spectra
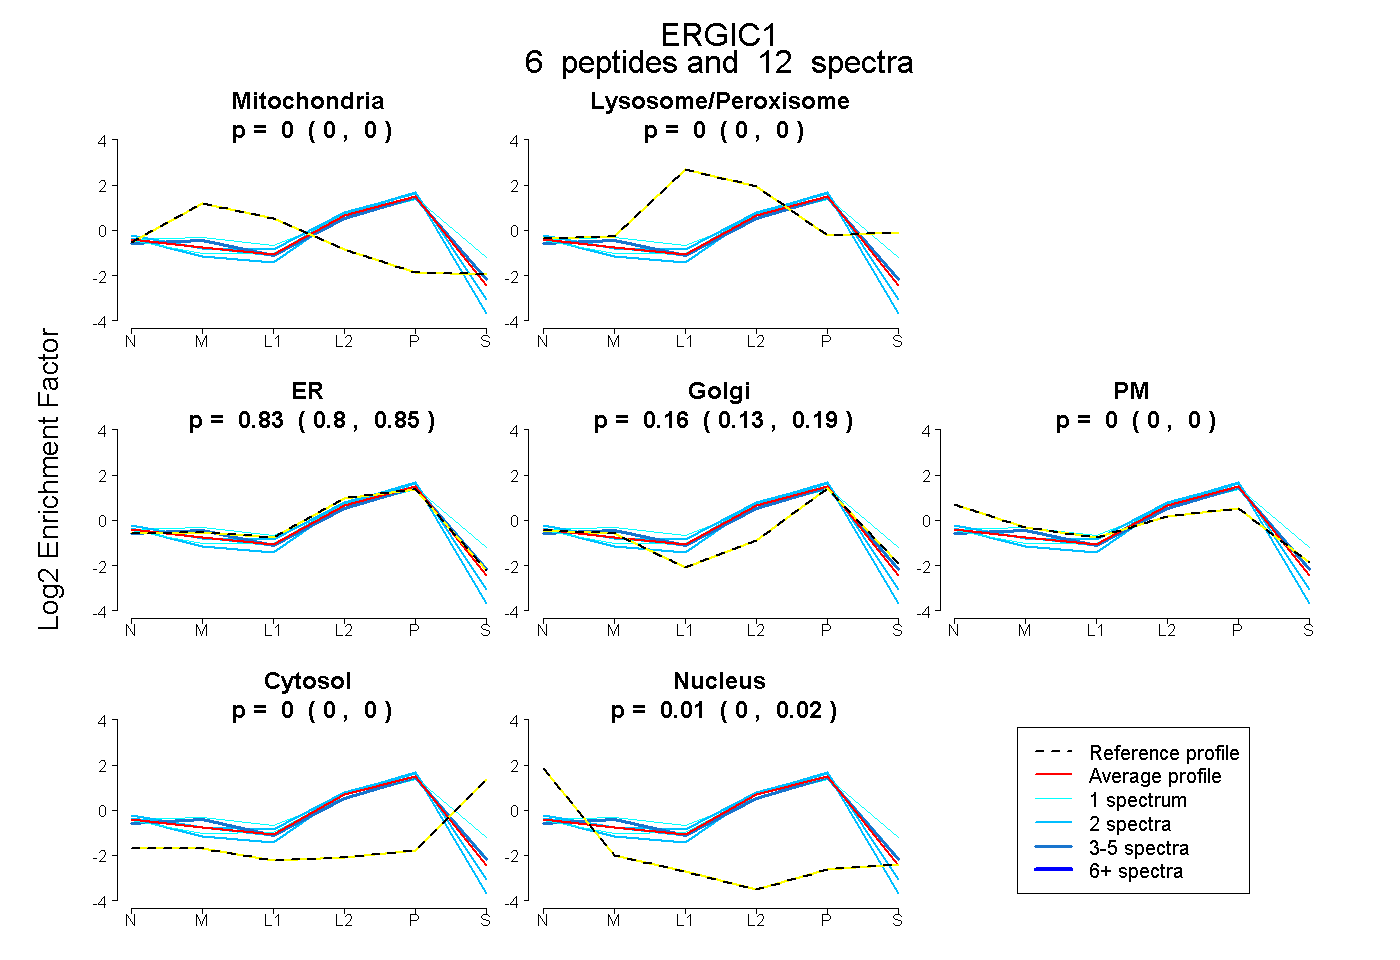
0.000 | 0.000
0.000 | 0.000
0.805 | 0.852
0.128 | 0.190
0.000 | 0.000
0.000 | 0.000
0.000 | 0.016