 11
11peptides
spectra
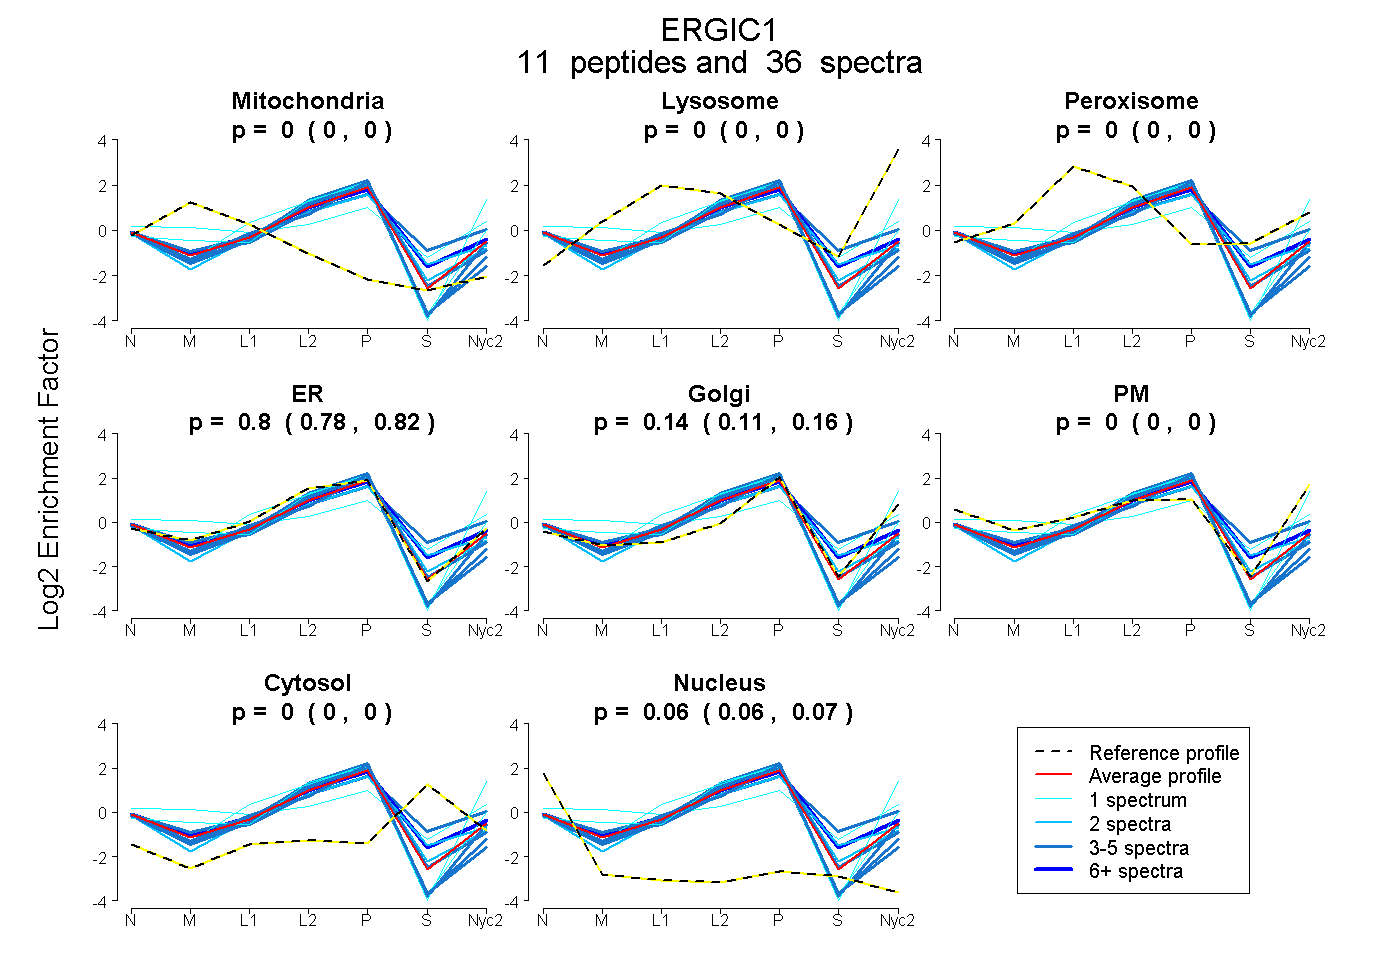
0.000 | 0.000
0.000 | 0.000
0.000 | 0.000
0.776 | 0.817
0.111 | 0.159
0.000 | 0.000
0.000 | 0.005
0.057 | 0.069
| Plot | Mito | Lyso | Perox | ER | Golgi | PM | Cytosol | Nucleus | |||||
| Expt A |
11 peptides |
36 spectra |
|
0.000 0.000 | 0.000 |
0.000 0.000 | 0.000 |
0.000 0.000 | 0.000 |
0.800 0.776 | 0.817 |
0.136 0.111 | 0.159 |
0.000 0.000 | 0.000 |
0.000 0.000 | 0.005 |
0.064 0.057 | 0.069 |
| 10 spectra, HEVGHIDNSMK | 0.000 | 0.000 | 0.000 | 0.773 | 0.076 | 0.000 | 0.151 | 0.000 | ||
| 3 spectra, YSYQYTVANK | 0.000 | 0.000 | 0.000 | 0.888 | 0.000 | 0.000 | 0.000 | 0.112 | ||
| 4 spectra, IPLNNGVGCR | 0.000 | 0.000 | 0.000 | 0.898 | 0.000 | 0.000 | 0.000 | 0.102 | ||
| 2 spectra, FDLYR | 0.000 | 0.000 | 0.000 | 0.874 | 0.020 | 0.000 | 0.043 | 0.063 | ||
| 1 spectrum, EYVAYSHTGR | 0.113 | 0.000 | 0.182 | 0.000 | 0.410 | 0.215 | 0.080 | 0.000 | ||
| 1 spectrum, LTSNPLASHDYILK | 0.000 | 0.000 | 0.000 | 0.916 | 0.079 | 0.005 | 0.000 | 0.000 | ||
| 4 spectra, IIPAIWFR | 0.000 | 0.000 | 0.000 | 0.931 | 0.016 | 0.000 | 0.000 | 0.053 | ||
| 4 spectra, LSFGDTLQVQNVHGAFNALGGADR | 0.000 | 0.000 | 0.000 | 0.898 | 0.010 | 0.000 | 0.006 | 0.087 | ||
| 2 spectra, IVPTVYEDK | 0.000 | 0.000 | 0.000 | 0.749 | 0.008 | 0.000 | 0.220 | 0.023 | ||
| 1 spectrum, YDLSPITVK | 0.000 | 0.000 | 0.000 | 0.337 | 0.277 | 0.386 | 0.000 | 0.000 | ||
| 4 spectra, FEGQFSINK | 0.000 | 0.000 | 0.027 | 0.484 | 0.183 | 0.080 | 0.226 | 0.000 |
| Plot | Mito | Lyso or Perox | ER | Golgi | PM | Cytosol | Nucleus | ||||||
| Expt B |
6 peptides |
12 spectra |
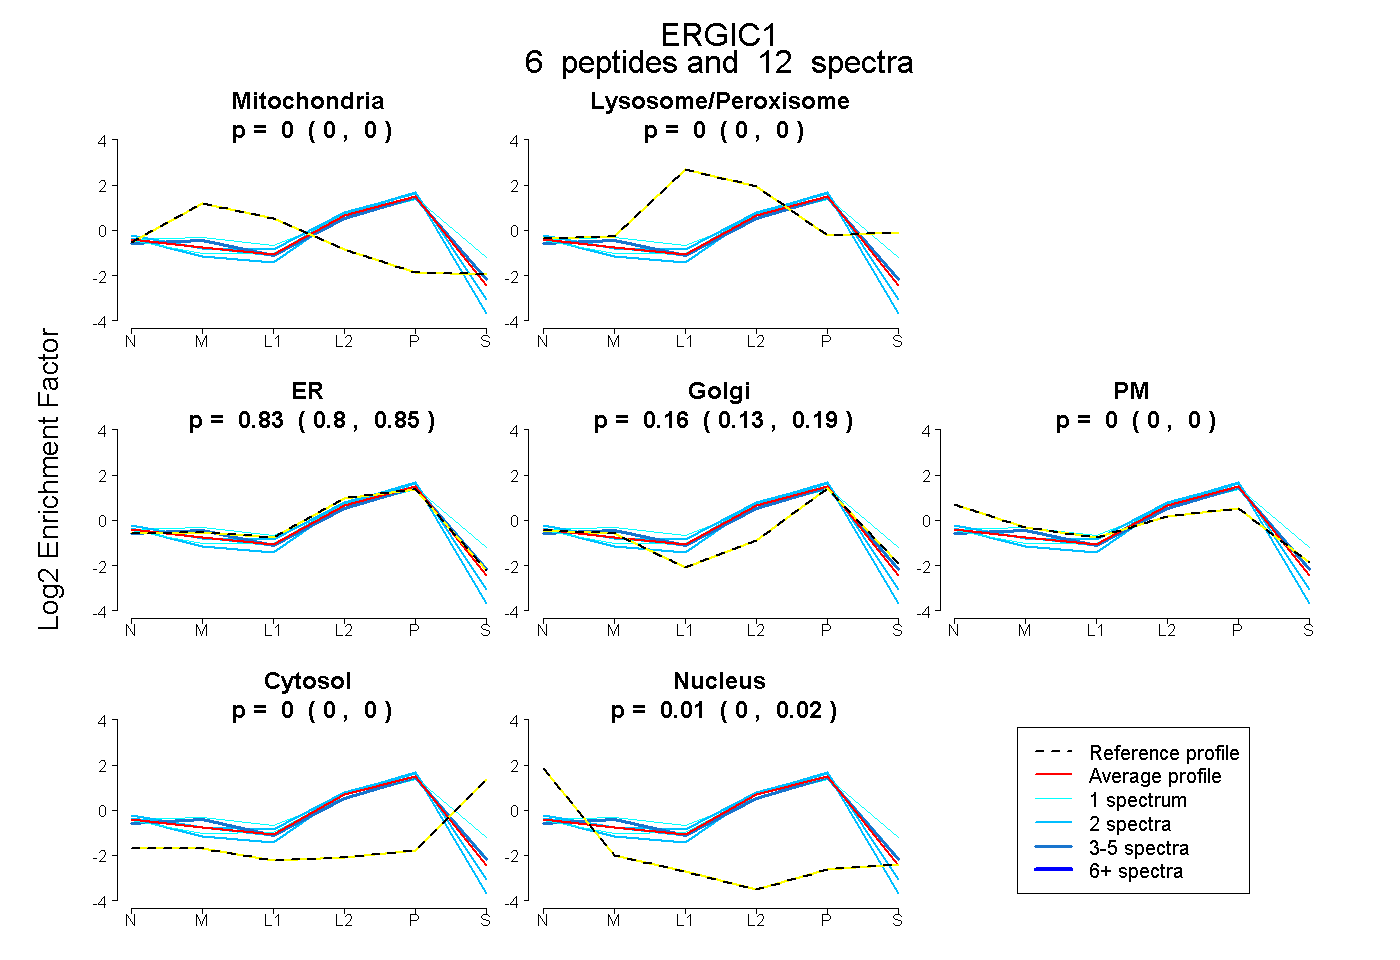 |
0.000 0.000 | 0.000 |
0.000 0.000 | 0.000 |
0.829 0.805 | 0.852 |
0.163 0.128 | 0.190 |
0.000 0.000 | 0.000 |
0.000 0.000 | 0.000 |
0.007 0.000 | 0.016 |
|||
| Plot | Lyso | Other | |||||||||||
| Expt C |
10 peptides |
35 spectra |
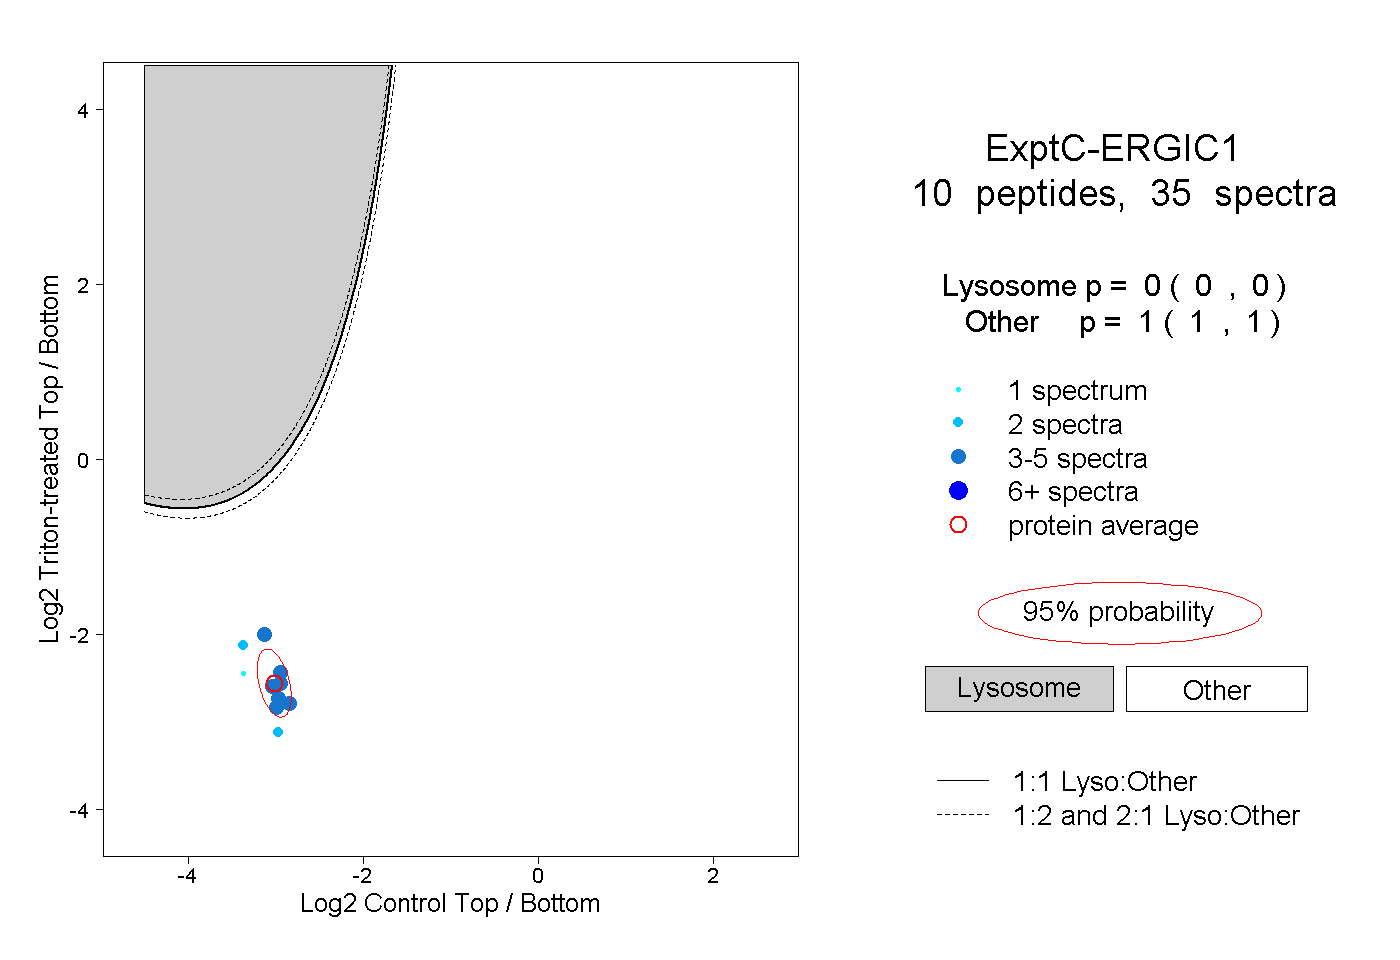 |
0.000 0.000 | 0.000 |
1.000 1.000 | 1.000 |
||||||||
| Plot | Lyso | Other | |||||||||||
| Expt D |
4 peptides |
9 spectra |
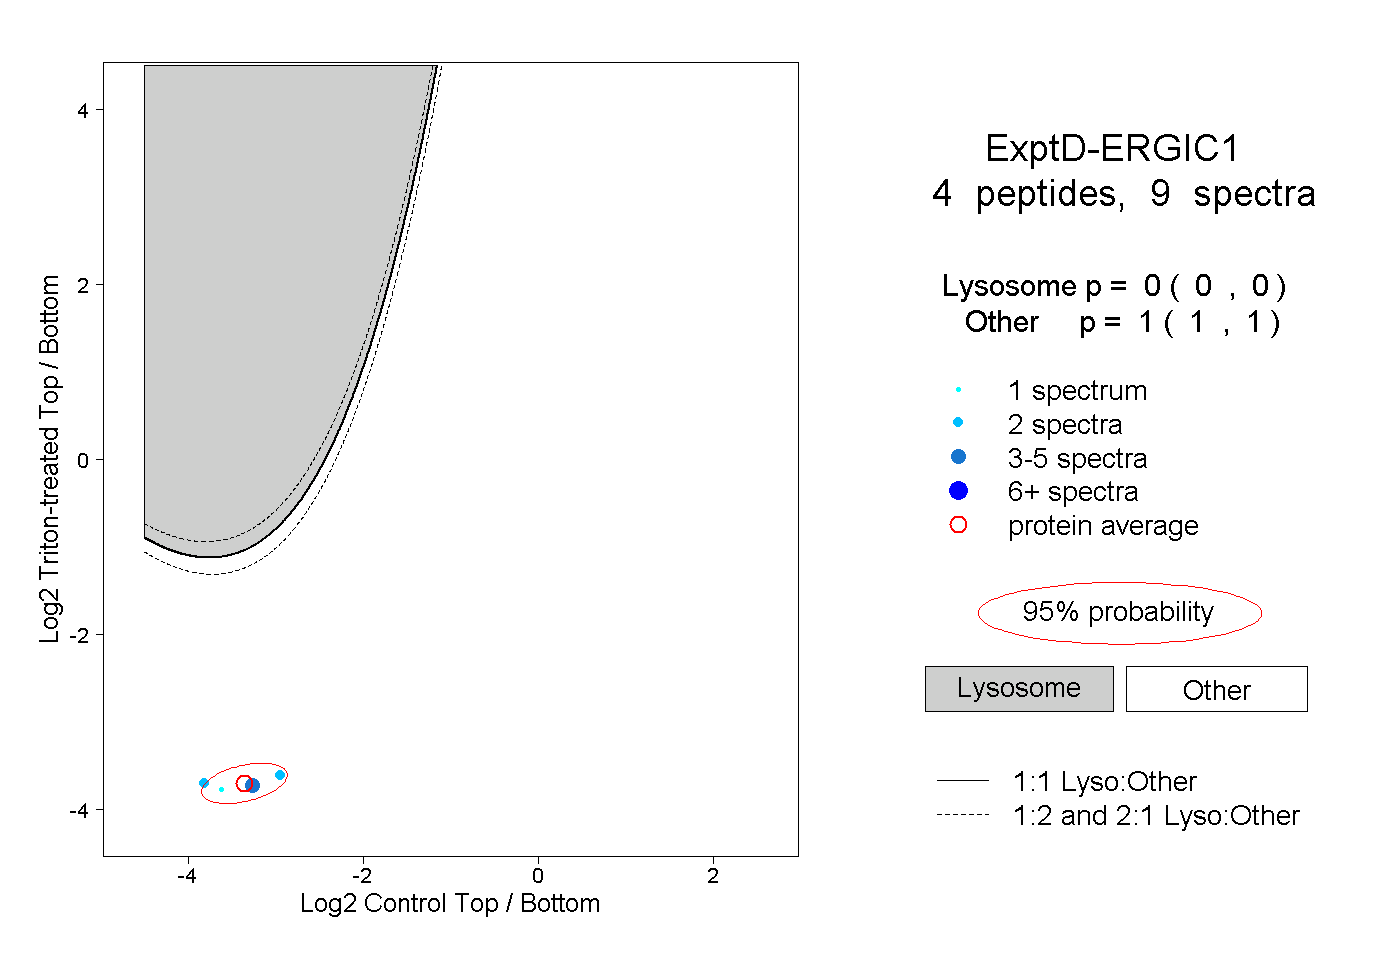 |
0.000 0.000 | 0.000 |
1.000 1.000 | 1.000 |