22
22peptides
spectra
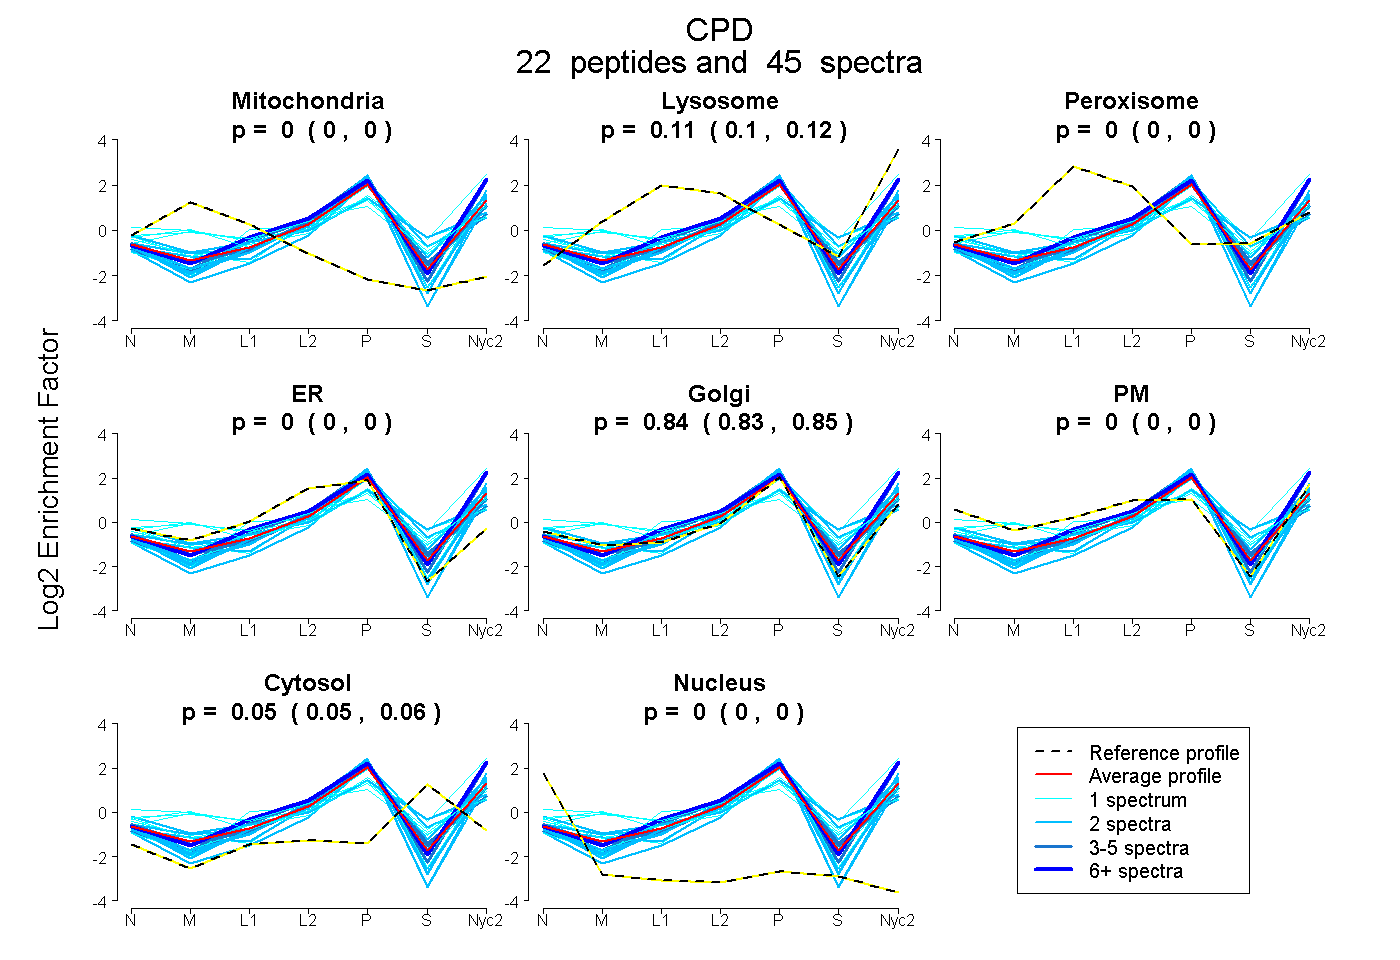
0.000 | 0.000
0.104 | 0.115
0.000 | 0.000
0.000 | 0.000
0.828 | 0.845
0.000 | 0.000
0.045 | 0.058
0.000 | 0.000
12peptides
spectra
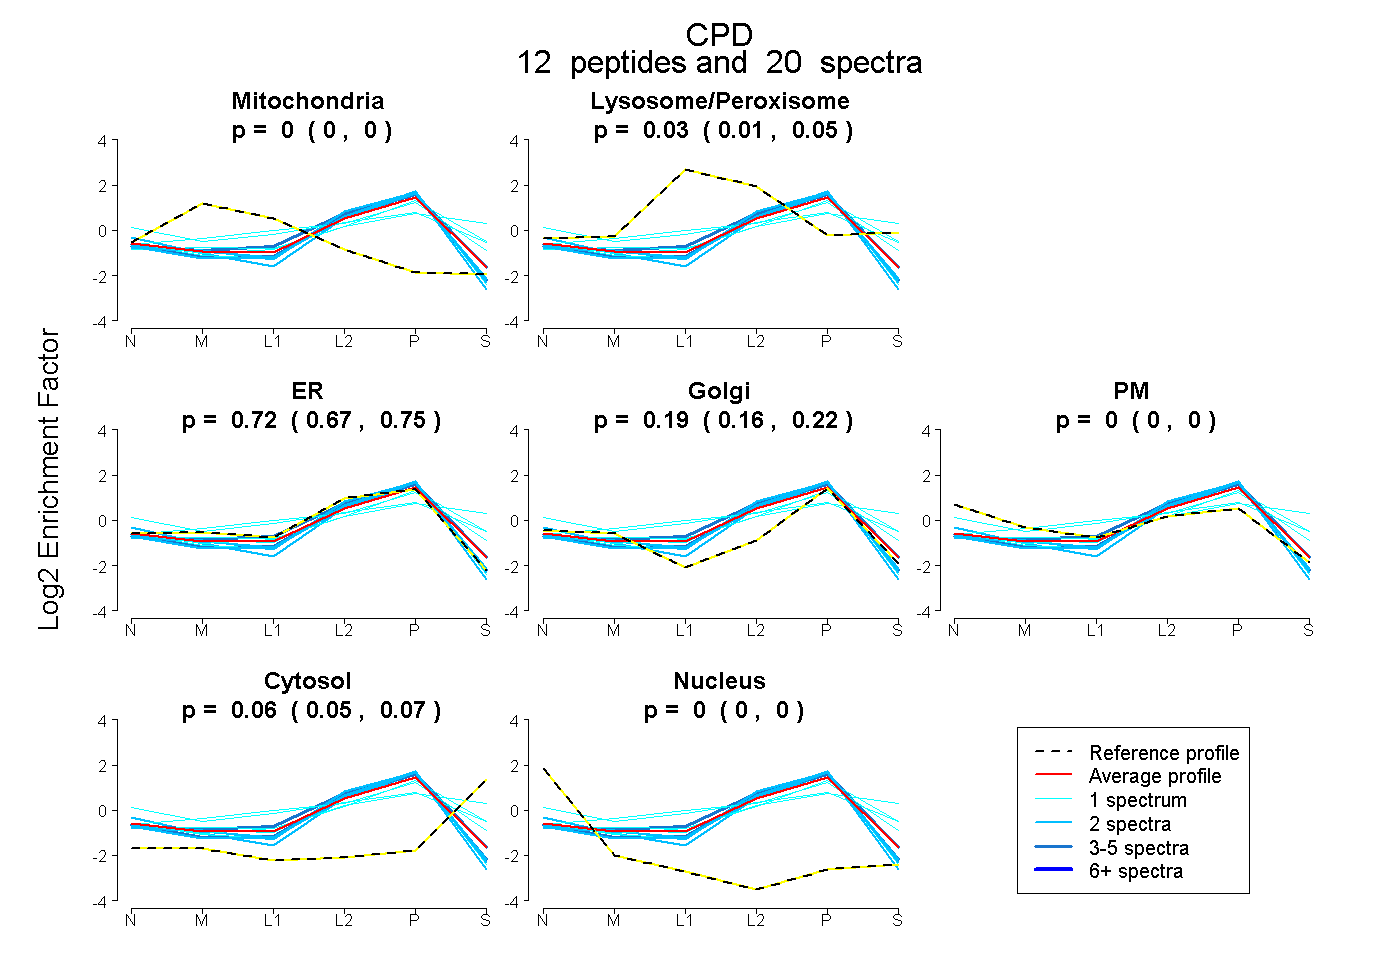
0.000 | 0.000
0.013 | 0.051
0.673 | 0.754
0.159 | 0.215
0.000 | 0.000
0.045 | 0.071
0.000 | 0.000