 22
22peptides
spectra
0.000 | 0.000
0.104 | 0.115
0.000 | 0.000
0.000 | 0.000
0.828 | 0.845
0.000 | 0.000
0.045 | 0.058
0.000 | 0.000
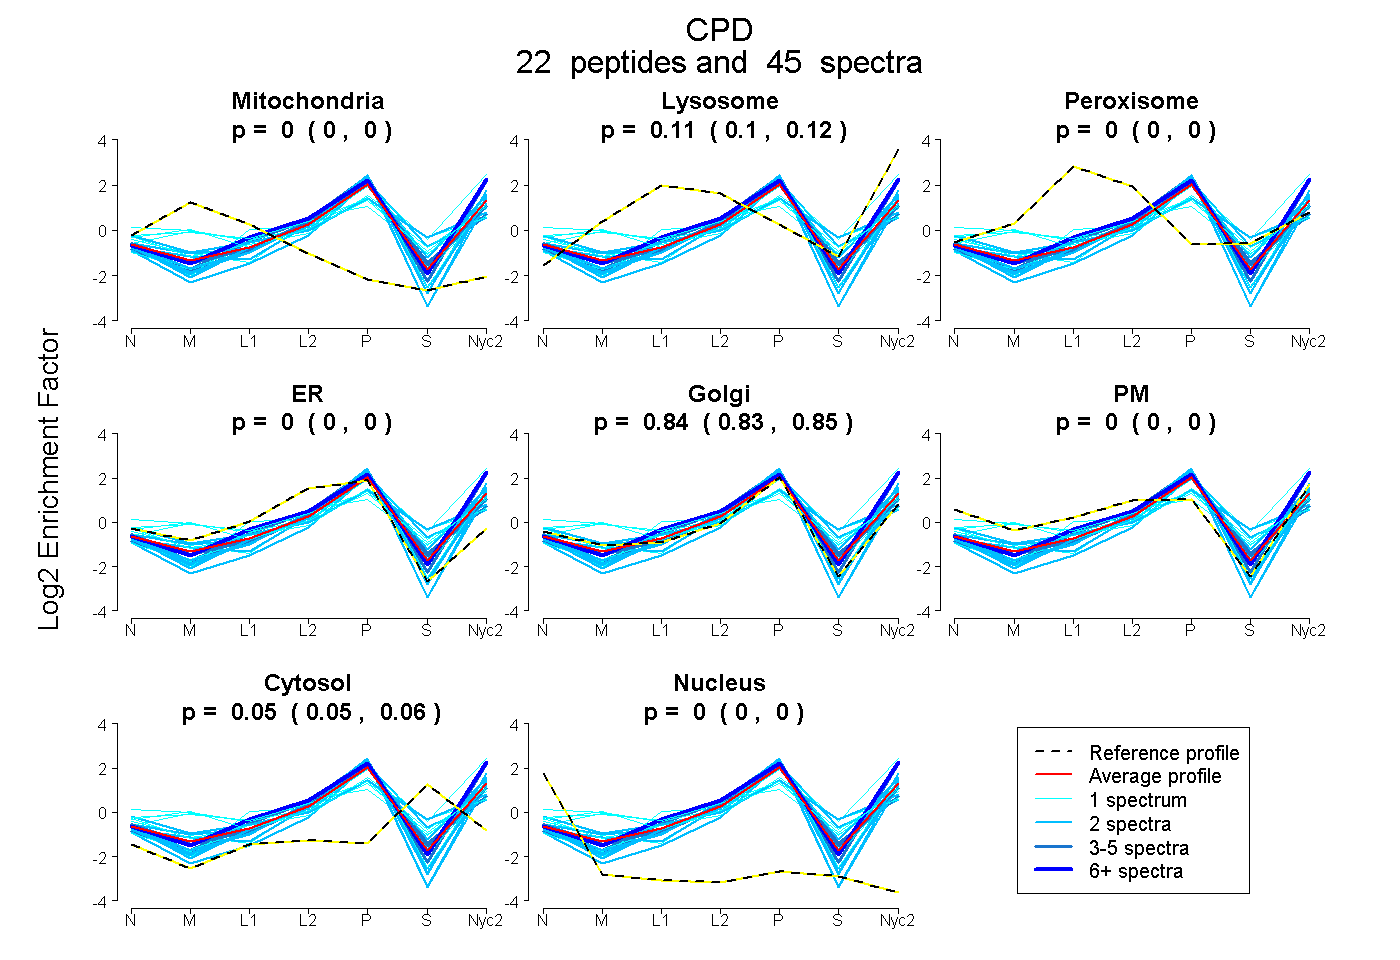
| Plot | Mito | Lyso | Perox | ER | Golgi | PM | Cytosol | Nucleus | |||||
| Expt A |
22 peptides |
45 spectra |
|
0.000 0.000 | 0.000 |
0.110 0.104 | 0.115 |
0.000 0.000 | 0.000 |
0.000 0.000 | 0.000 |
0.837 0.828 | 0.845 |
0.000 0.000 | 0.000 |
0.053 0.045 | 0.058 |
0.000 0.000 | 0.000 |
| 6 spectra, TSDDEVFR | 0.000 | 0.246 | 0.000 | 0.000 | 0.754 | 0.000 | 0.000 | 0.000 | ||
| 1 spectrum, ENSQMFQGRPCK | 0.000 | 0.048 | 0.000 | 0.007 | 0.905 | 0.000 | 0.040 | 0.000 | ||
| 1 spectrum, FGDFHR | 0.000 | 0.061 | 0.000 | 0.000 | 0.926 | 0.000 | 0.013 | 0.000 | ||
| 1 spectrum, IVIVPSLNPDGR | 0.000 | 0.033 | 0.000 | 0.000 | 0.967 | 0.000 | 0.000 | 0.000 | ||
| 1 spectrum, ELASGYR | 0.019 | 0.000 | 0.114 | 0.047 | 0.242 | 0.416 | 0.161 | 0.000 | ||
| 2 spectra, QVHQGVK | 0.000 | 0.081 | 0.055 | 0.000 | 0.496 | 0.099 | 0.270 | 0.000 | ||
| 1 spectrum, QEWENNR | 0.000 | 0.170 | 0.090 | 0.000 | 0.591 | 0.000 | 0.148 | 0.000 | ||
| 4 spectra, EGDCGLGDSGPPGTSGR | 0.000 | 0.008 | 0.000 | 0.085 | 0.757 | 0.000 | 0.150 | 0.000 | ||
| 3 spectra, QVLVYLAR | 0.000 | 0.080 | 0.000 | 0.005 | 0.821 | 0.000 | 0.095 | 0.000 | ||
| 2 spectra, NFGTDPEVTDLVR | 0.000 | 0.096 | 0.000 | 0.000 | 0.868 | 0.000 | 0.036 | 0.000 | ||
| 2 spectra, ESLITLIEK | 0.000 | 0.165 | 0.000 | 0.000 | 0.739 | 0.000 | 0.096 | 0.000 | ||
| 2 spectra, AVIVLNEGIR | 0.000 | 0.000 | 0.000 | 0.000 | 0.717 | 0.000 | 0.283 | 0.000 | ||
| 1 spectrum, GYNPVTK | 0.000 | 0.336 | 0.000 | 0.000 | 0.496 | 0.000 | 0.168 | 0.000 | ||
| 1 spectrum, YWEQNR | 0.025 | 0.154 | 0.000 | 0.000 | 0.499 | 0.158 | 0.164 | 0.000 | ||
| 2 spectra, SQEGDSISVVGR | 0.000 | 0.004 | 0.000 | 0.000 | 0.996 | 0.000 | 0.000 | 0.000 | ||
| 5 spectra, ALIDWIR | 0.000 | 0.186 | 0.000 | 0.000 | 0.814 | 0.000 | 0.000 | 0.000 | ||
| 2 spectra, NPVVTQLVDR | 0.000 | 0.000 | 0.000 | 0.000 | 1.000 | 0.000 | 0.000 | 0.000 | ||
| 1 spectrum, YIGNMHGNEVVGR | 0.000 | 0.125 | 0.083 | 0.000 | 0.490 | 0.191 | 0.111 | 0.000 | ||
| 2 spectra, LLVPGTYK | 0.000 | 0.000 | 0.000 | 0.033 | 0.910 | 0.057 | 0.000 | 0.000 | ||
| 2 spectra, GFVLDATDGR | 0.000 | 0.054 | 0.000 | 0.000 | 0.946 | 0.000 | 0.000 | 0.000 | ||
| 2 spectra, IFGLPR | 0.000 | 0.002 | 0.000 | 0.000 | 0.998 | 0.000 | 0.000 | 0.000 | ||
| 1 spectrum, LVGNMHGDETVSR | 0.000 | 0.026 | 0.090 | 0.000 | 0.614 | 0.000 | 0.270 | 0.000 |
| Plot | Mito | Lyso or Perox | ER | Golgi | PM | Cytosol | Nucleus | ||||||
| Expt B |
12 peptides |
20 spectra |
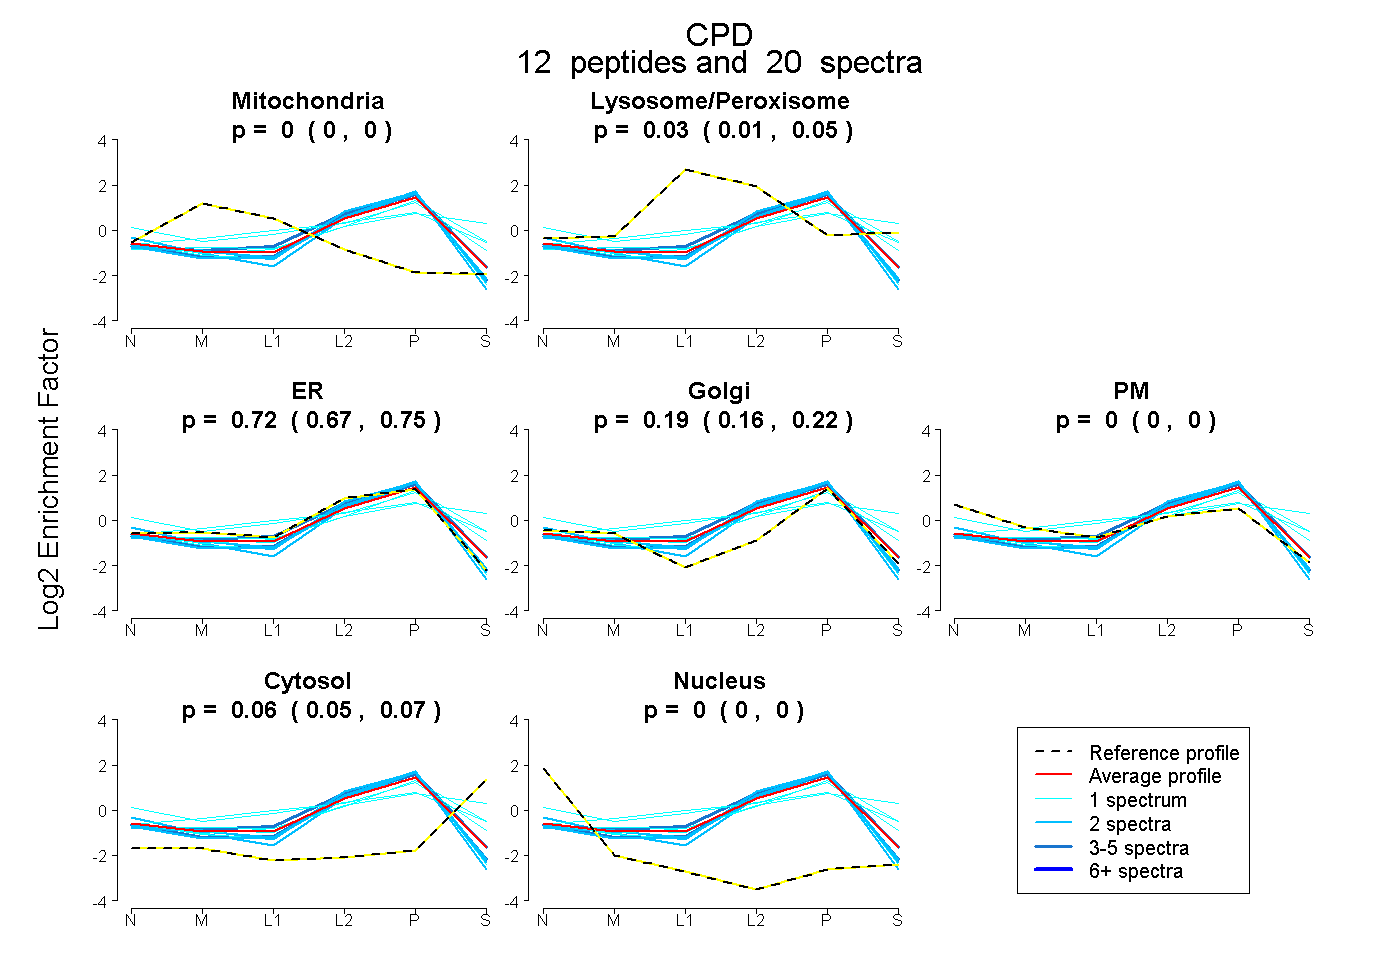 |
0.000 0.000 | 0.000 |
0.034 0.013 | 0.051 |
0.717 0.673 | 0.754 |
0.189 0.159 | 0.215 |
0.000 0.000 | 0.000 |
0.060 0.045 | 0.071 |
0.000 0.000 | 0.000 |
|||
| Plot | Lyso | Other | |||||||||||
| Expt C |
24 peptides |
53 spectra |
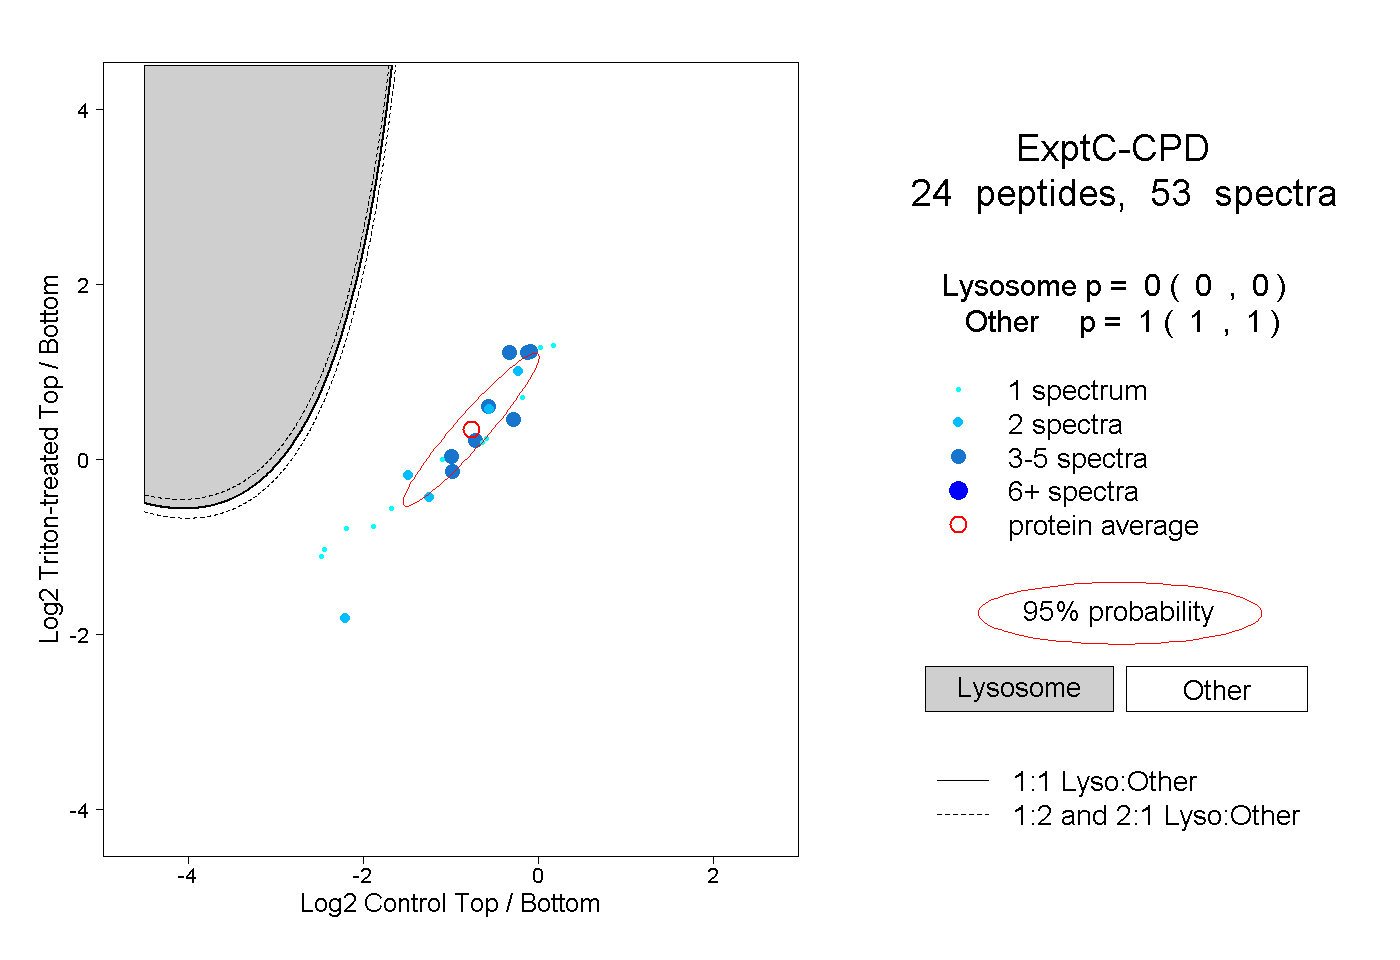 |
0.000 0.000 | 0.000 |
1.000 1.000 | 1.000 |
||||||||
| Plot | Lyso | Other | |||||||||||
| Expt D |
6 peptides |
11 spectra |
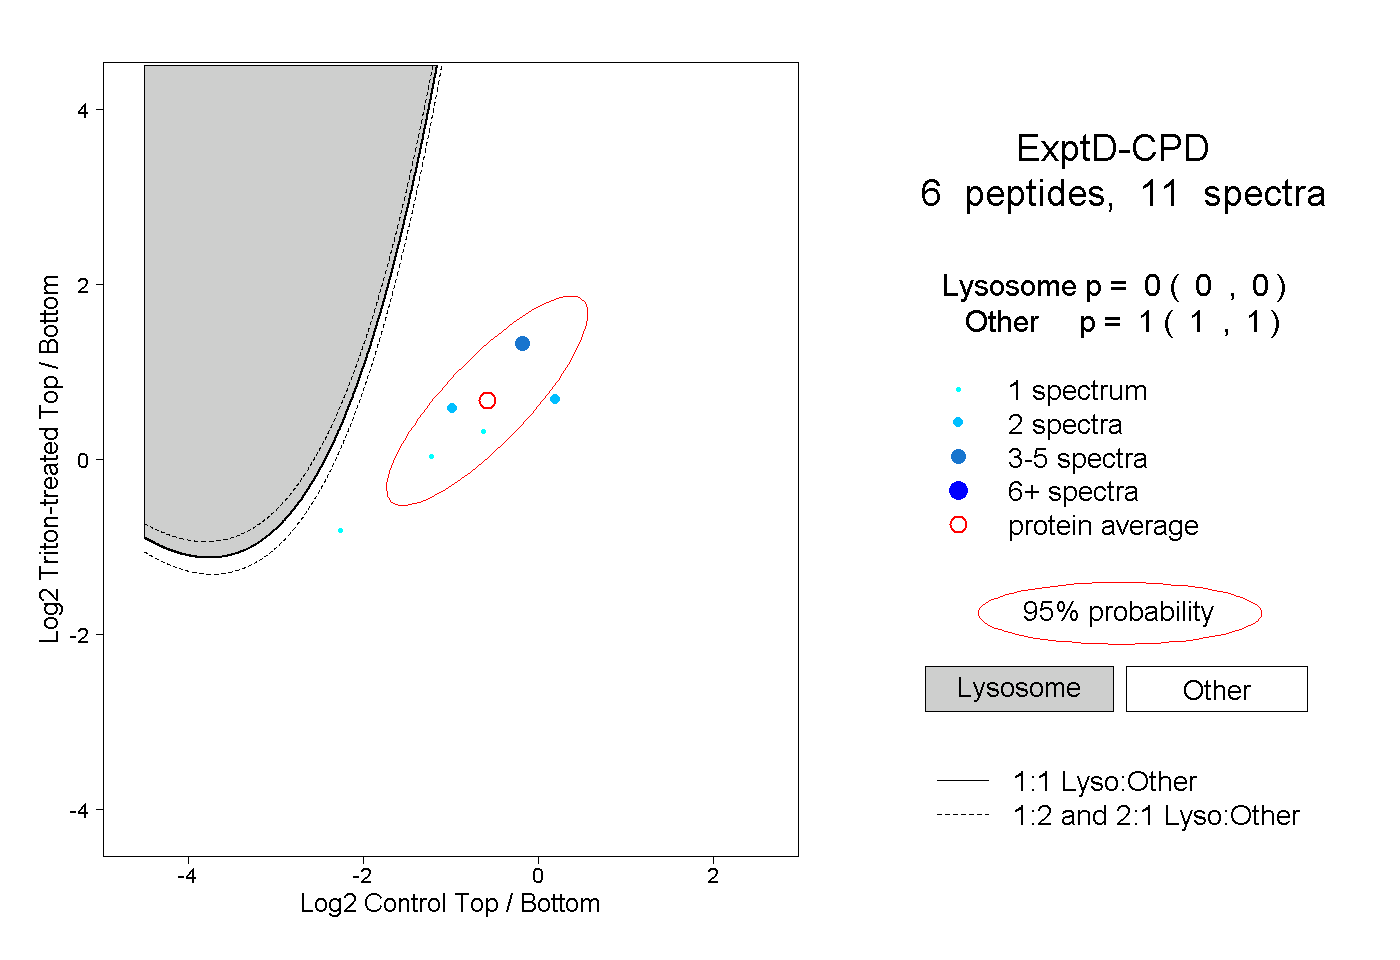 |
0.000 0.000 | 0.000 |
1.000 1.000 | 1.000 |