 2
2peptides
spectra
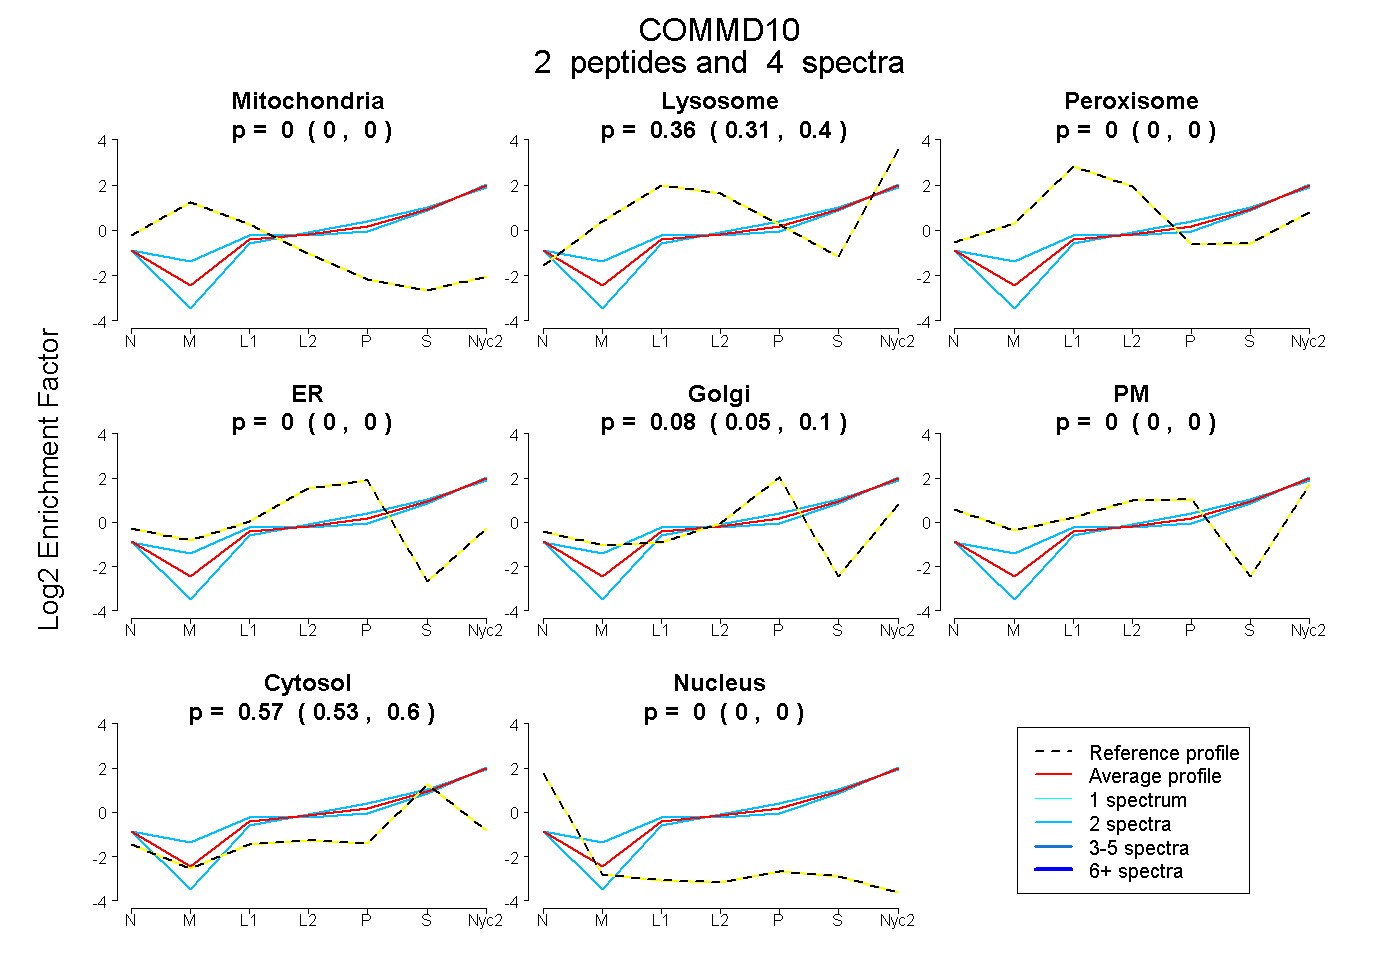
0.000 | 0.000
0.310 | 0.396
0.000 | 0.000
0.000 | 0.000
0.046 | 0.102
0.000 | 0.000
0.530 | 0.598
0.000 | 0.000
2peptides
spectra
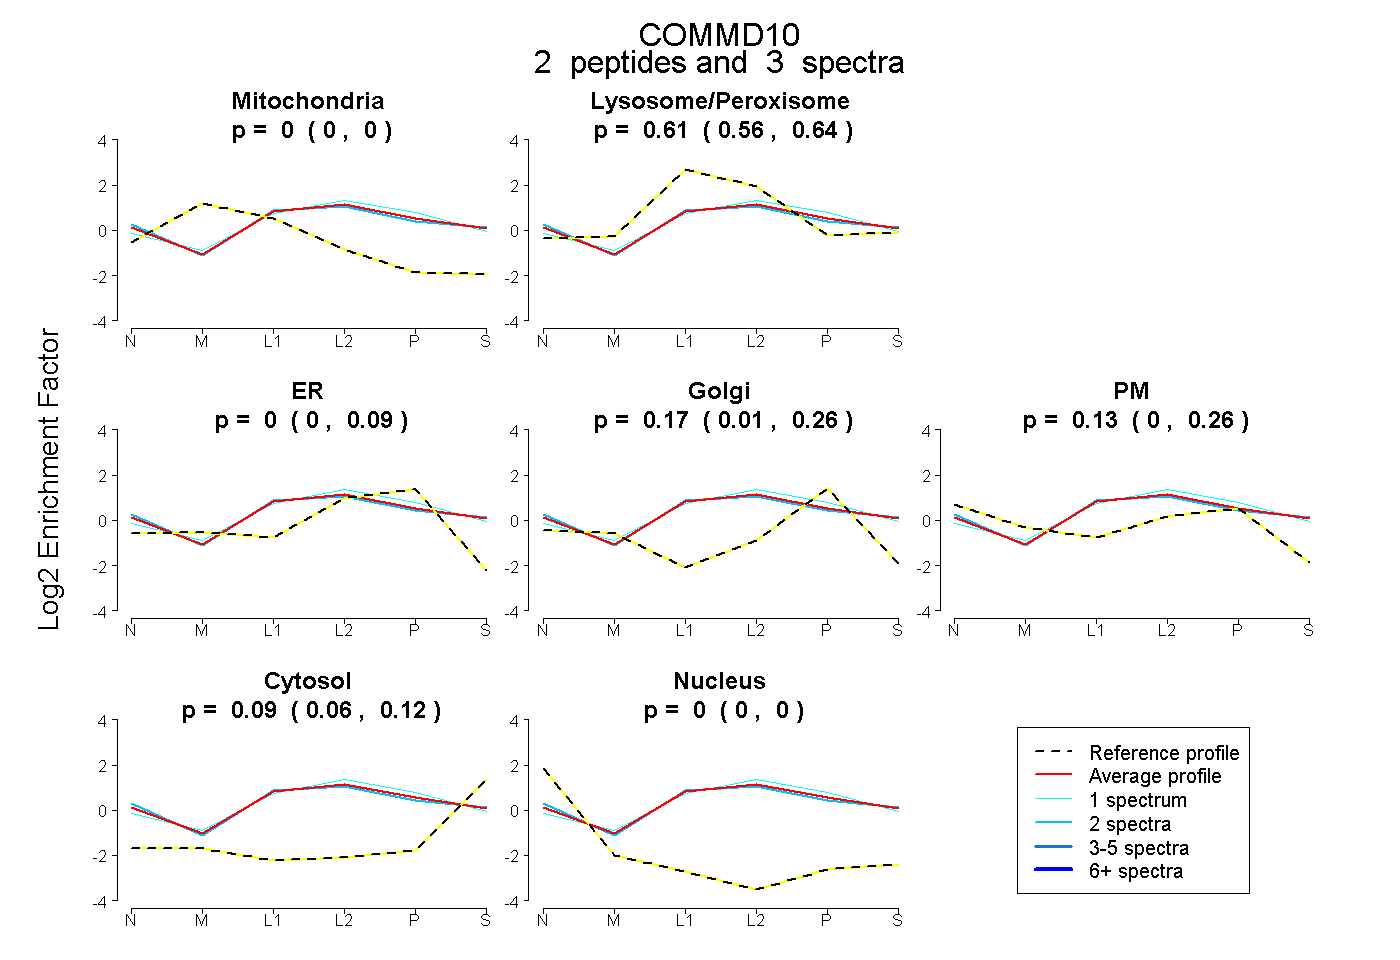
0.000 | 0.000
0.557 | 0.643
0.000 | 0.086
0.009 | 0.260
0.000 | 0.256
0.056 | 0.124
0.000 | 0.000
4peptides
spectra
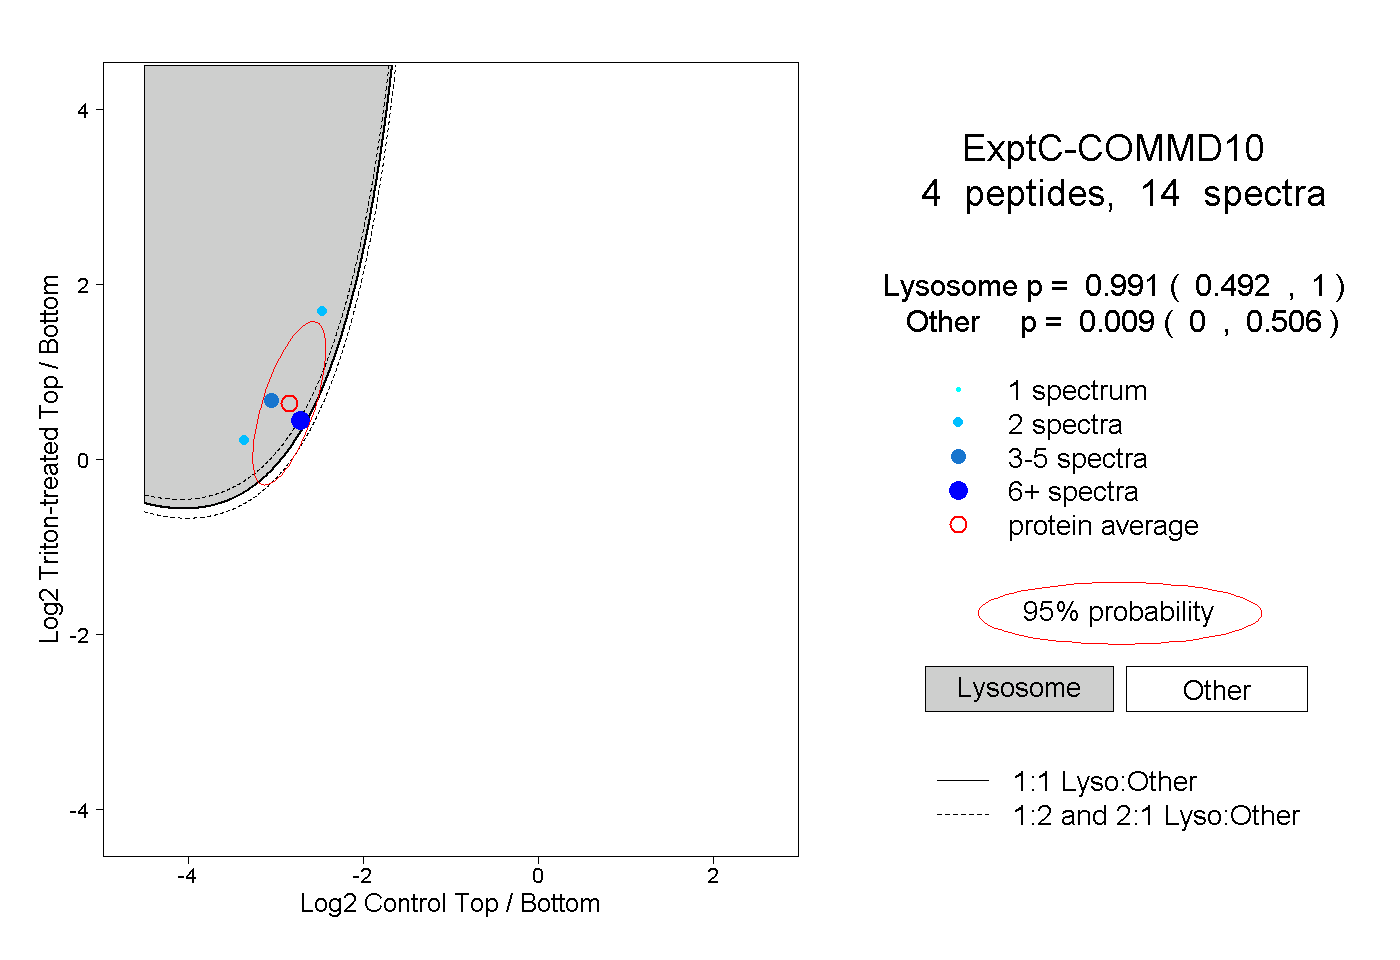
0.492 | 1.000
0.000 | 0.506