 5
5peptides
spectra
0.000 | 0.000
0.000 | 0.000
0.341 | 0.382
0.046 | 0.151
0.334 | 0.433
0.020 | 0.091
0.069 | 0.099
0.000 | 0.000
| Plot | Mito | Lyso | Perox | ER | Golgi | PM | Cytosol | Nucleus | |||||
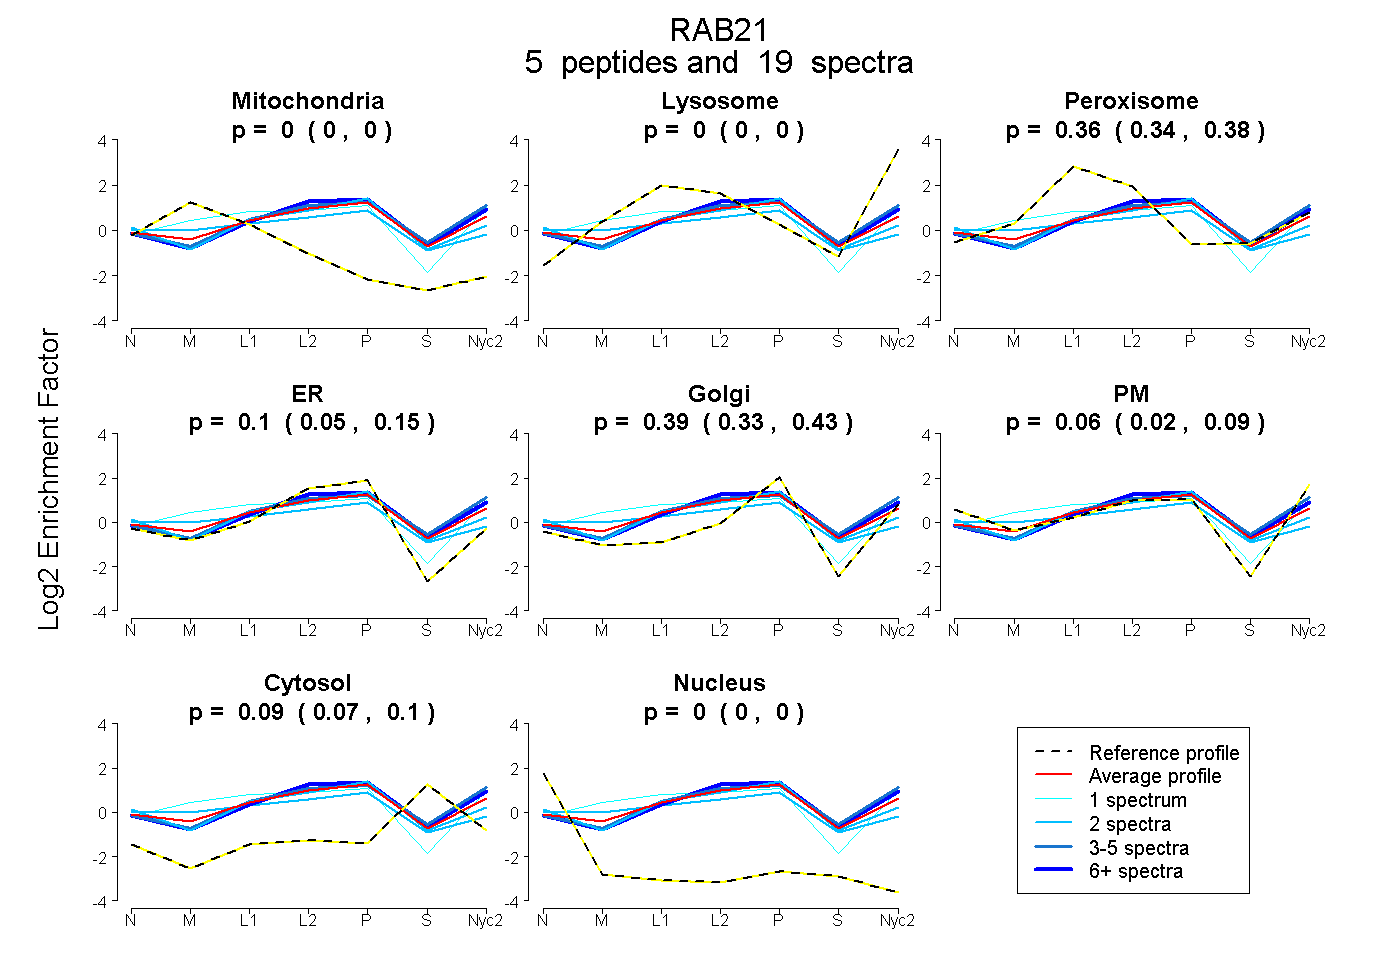
| Expt A |
5 peptides |
19 spectra |
|
0.000 0.000 | 0.000 |
0.000 0.000 | 0.000 |
0.364 0.341 | 0.382 |
0.104 0.046 | 0.151 |
0.387 0.334 | 0.433 |
0.060 0.020 | 0.091 |
0.085 0.069 | 0.099 |
0.000 0.000 | 0.000 |
| 5 spectra, VNLAIWDTAGQER | 0.000 | 0.153 | 0.178 | 0.160 | 0.147 | 0.210 | 0.152 | 0.000 | ||
| 2 spectra, VVLLGEGCVGK | 0.000 | 0.000 | 0.250 | 0.332 | 0.203 | 0.078 | 0.137 | 0.000 | ||
| 1 spectrum, FHALGPIYYR | 0.096 | 0.185 | 0.128 | 0.205 | 0.107 | 0.280 | 0.000 | 0.000 | ||
| 9 spectra, MIETAQVDER | 0.000 | 0.184 | 0.083 | 0.374 | 0.001 | 0.189 | 0.170 | 0.000 | ||
| 2 spectra, GIEELFLDLCK | 0.097 | 0.000 | 0.275 | 0.247 | 0.243 | 0.016 | 0.122 | 0.000 |
| Plot | Mito | Lyso or Perox | ER | Golgi | PM | Cytosol | Nucleus | ||||||
| Expt B |
3 peptides |
8 spectra |
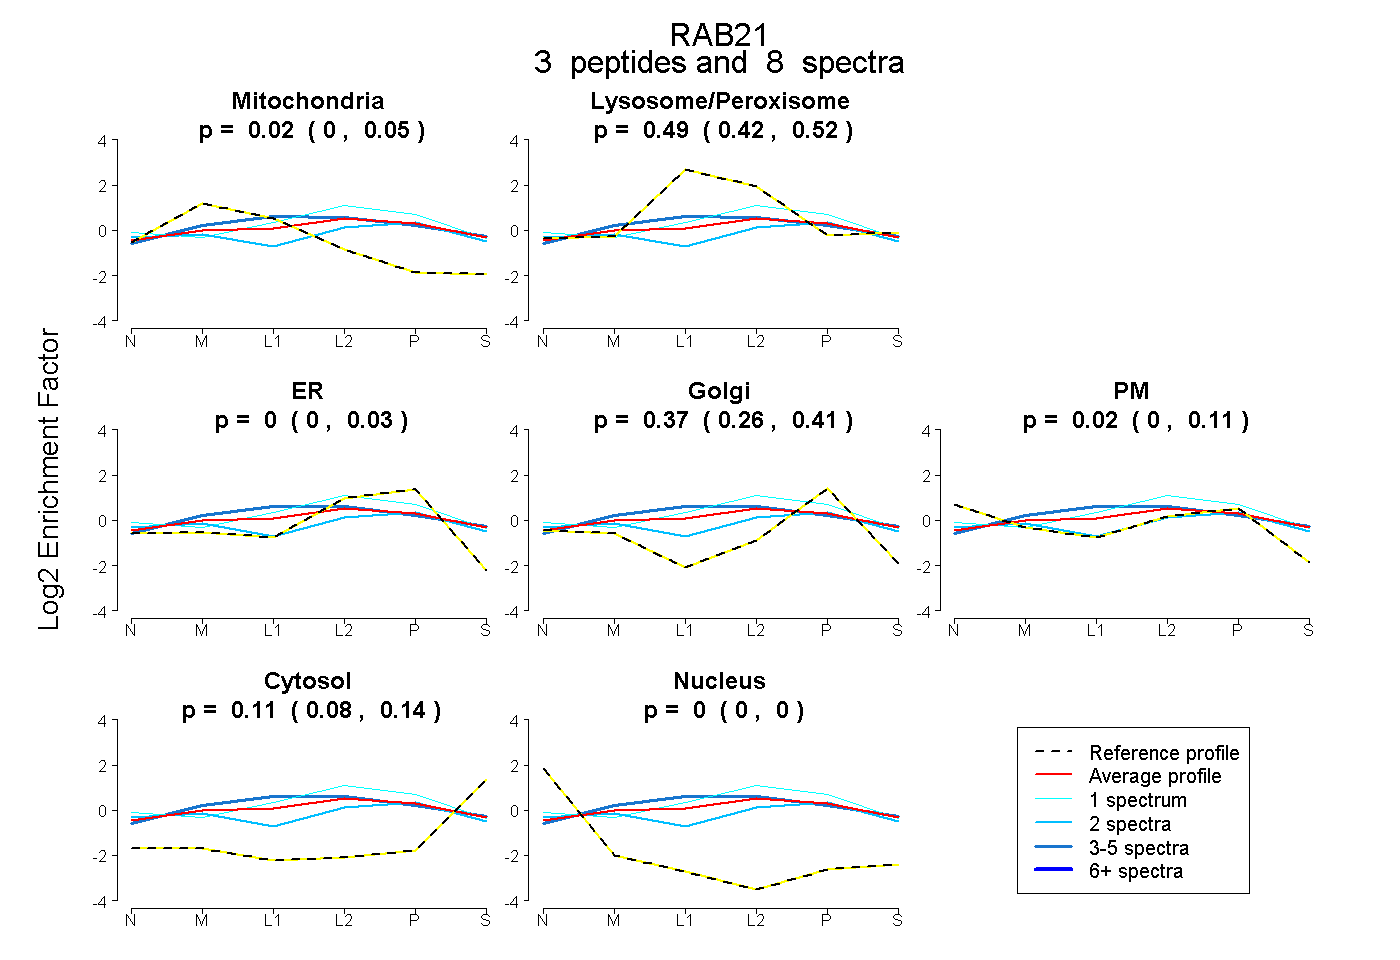 |
0.016 0.000 | 0.049 |
0.486 0.419 | 0.522 |
0.000 0.000 | 0.028 |
0.370 0.263 | 0.409 |
0.018 0.000 | 0.111 |
0.110 0.080 | 0.142 |
0.000 0.000 | 0.000 |
|||
| Plot | Lyso | Other | |||||||||||
| Expt C |
6 peptides |
23 spectra |
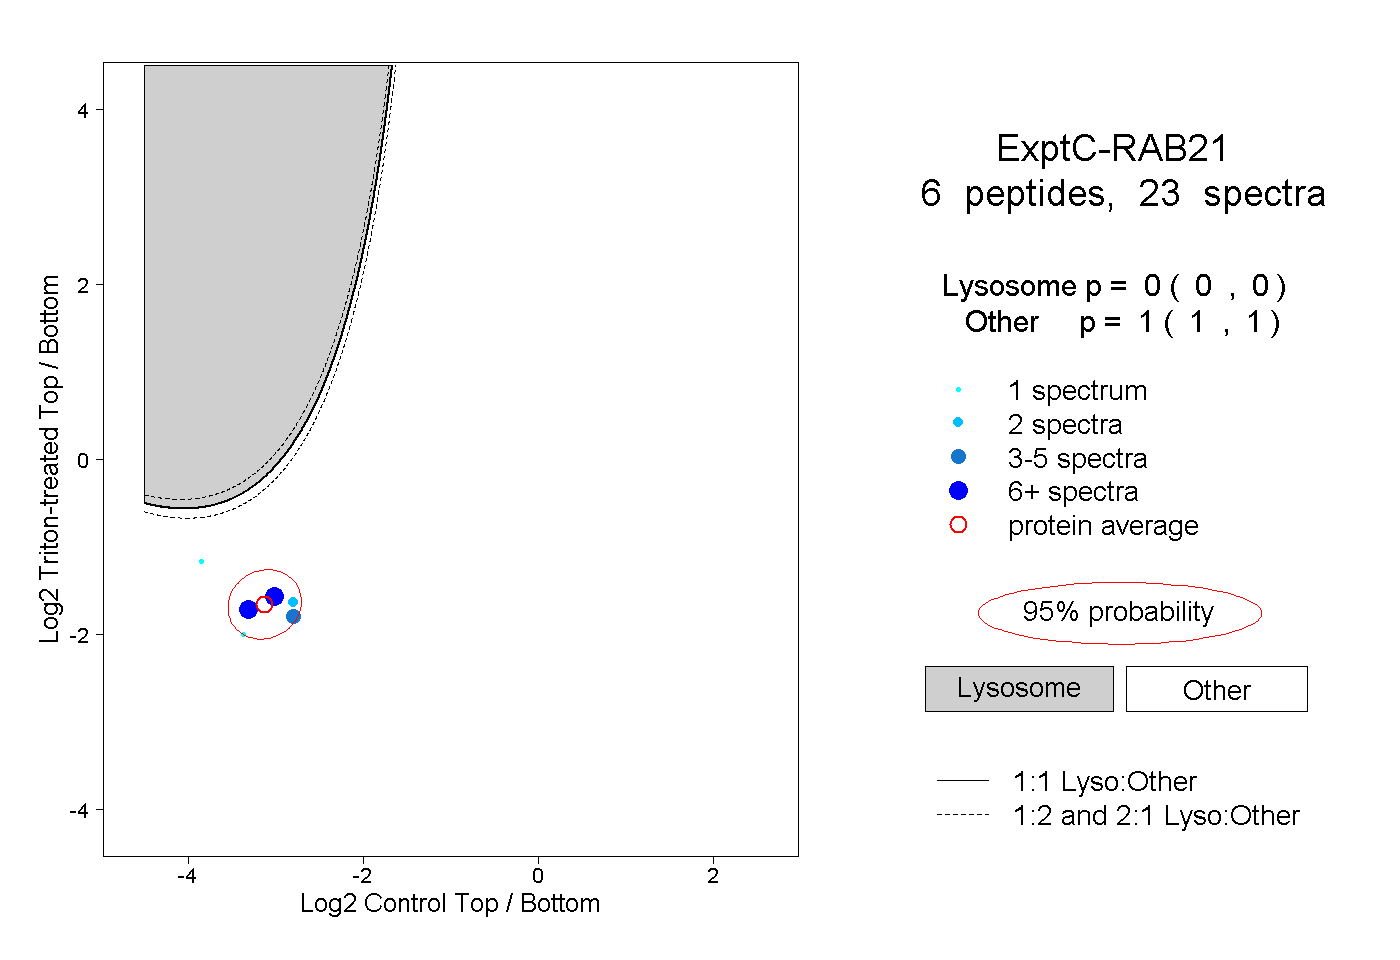 |
0.000 0.000 | 0.000 |
1.000 1.000 | 1.000 |
||||||||
| Plot | Lyso | Other | |||||||||||
| Expt D |
5 peptides |
5 spectra |
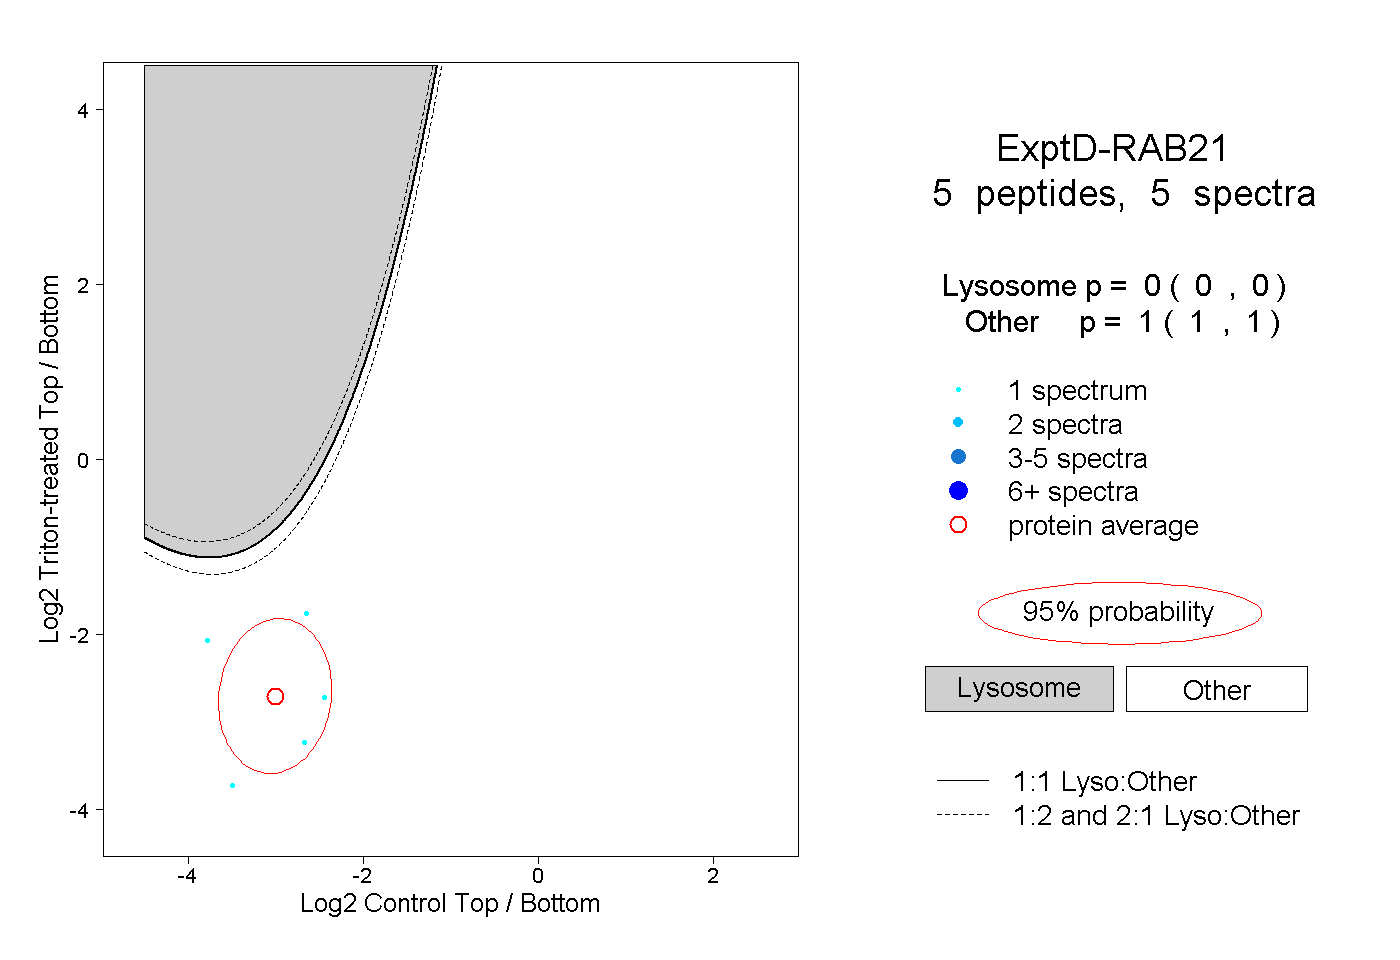 |
0.000 0.000 | 0.000 |
1.000 1.000 | 1.000 |