 2
2peptides
spectra
0.000 | 0.000
0.076 | 0.188
0.048 | 0.152
0.000 | 0.063
0.000 | 0.000
0.537 | 0.694
0.077 | 0.140
0.000 | 0.000
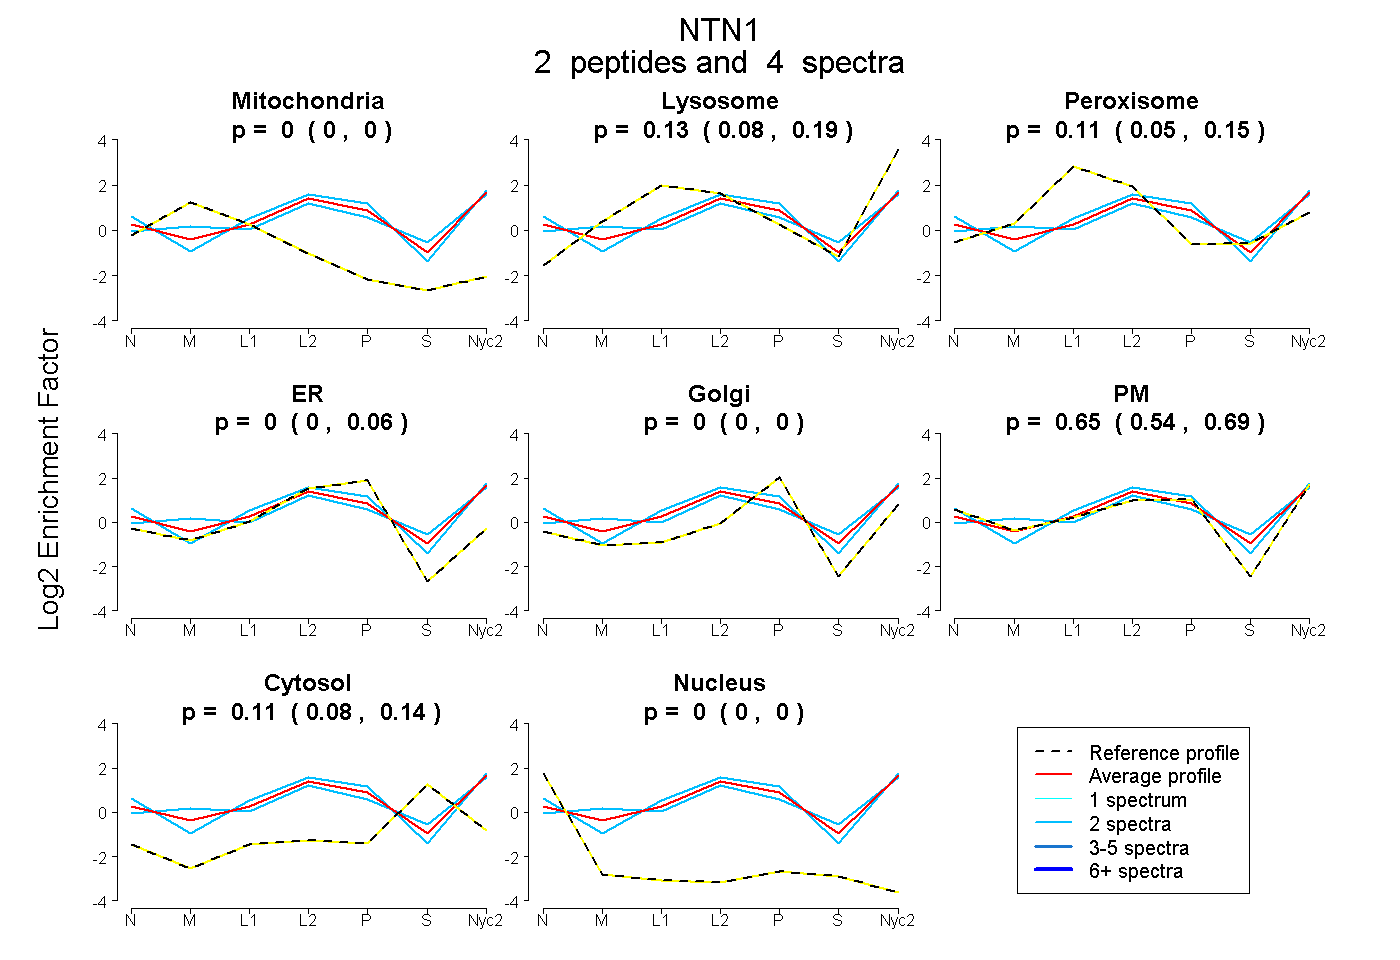
| Plot | Mito | Lyso | Perox | ER | Golgi | PM | Cytosol | Nucleus | |||||
| Expt A |
2 peptides |
4 spectra |
|
0.000 0.000 | 0.000 |
0.130 0.076 | 0.188 |
0.112 0.048 | 0.152 |
0.000 0.000 | 0.063 |
0.000 0.000 | 0.000 |
0.647 0.537 | 0.694 |
0.111 0.077 | 0.140 |
0.000 0.000 | 0.000 |
| 2 spectra, LHTFGDENEDDSELAR | 0.000 | 0.224 | 0.100 | 0.000 | 0.000 | 0.495 | 0.181 | 0.000 | ||
| 2 spectra, VSSTCGRPPAR | 0.000 | 0.052 | 0.114 | 0.038 | 0.000 | 0.757 | 0.040 | 0.000 |