 2
2peptides
spectra
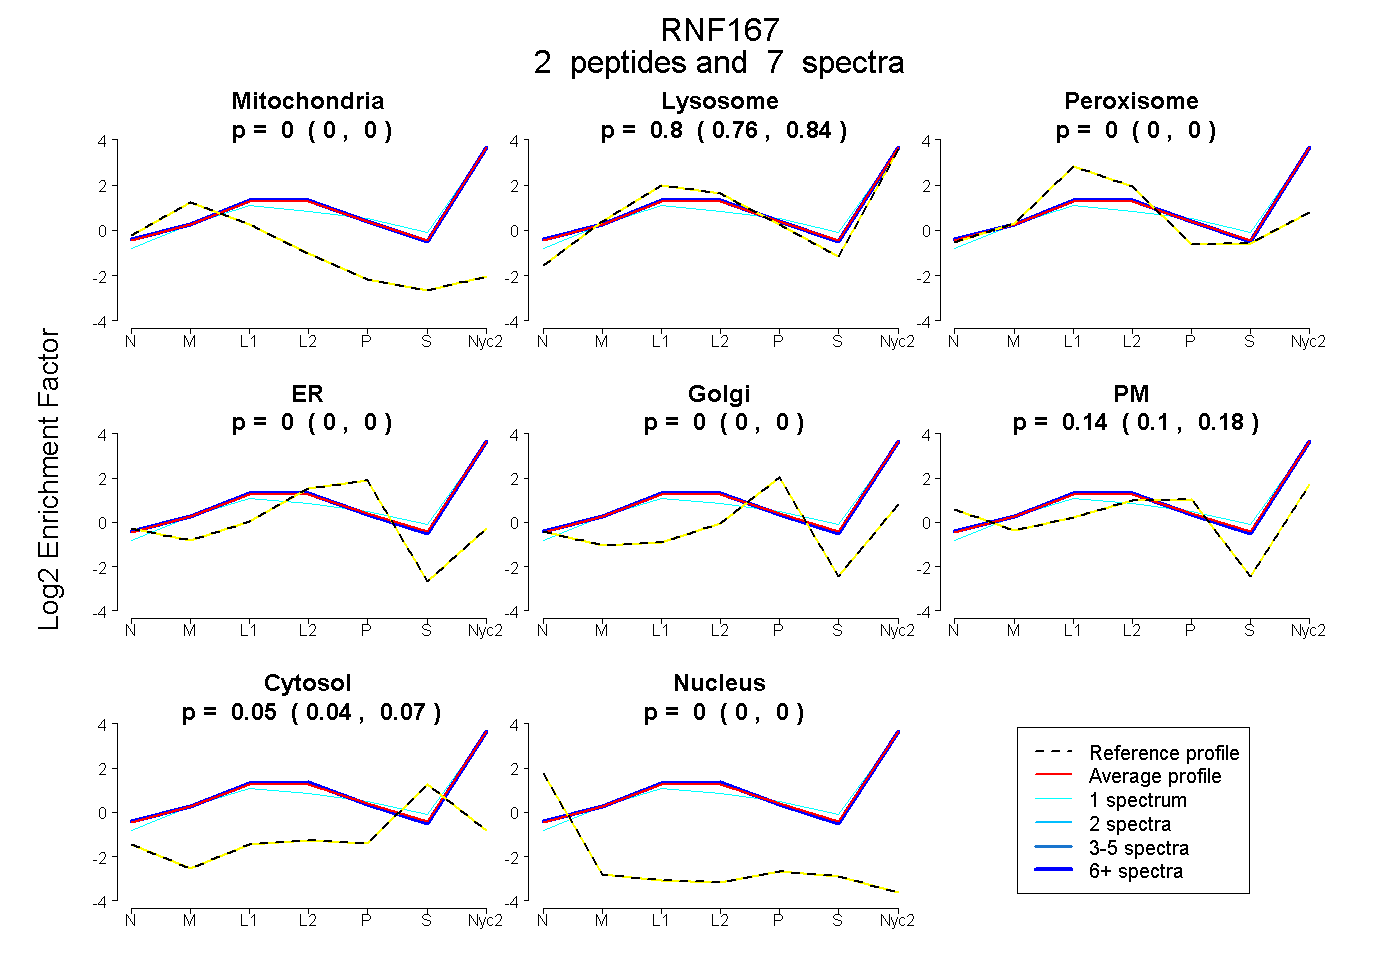
0.000 | 0.000
0.764 | 0.836
0.000 | 0.000
0.000 | 0.000
0.000 | 0.000
0.100 | 0.178
0.037 | 0.070
0.000 | 0.000
4peptides
spectra
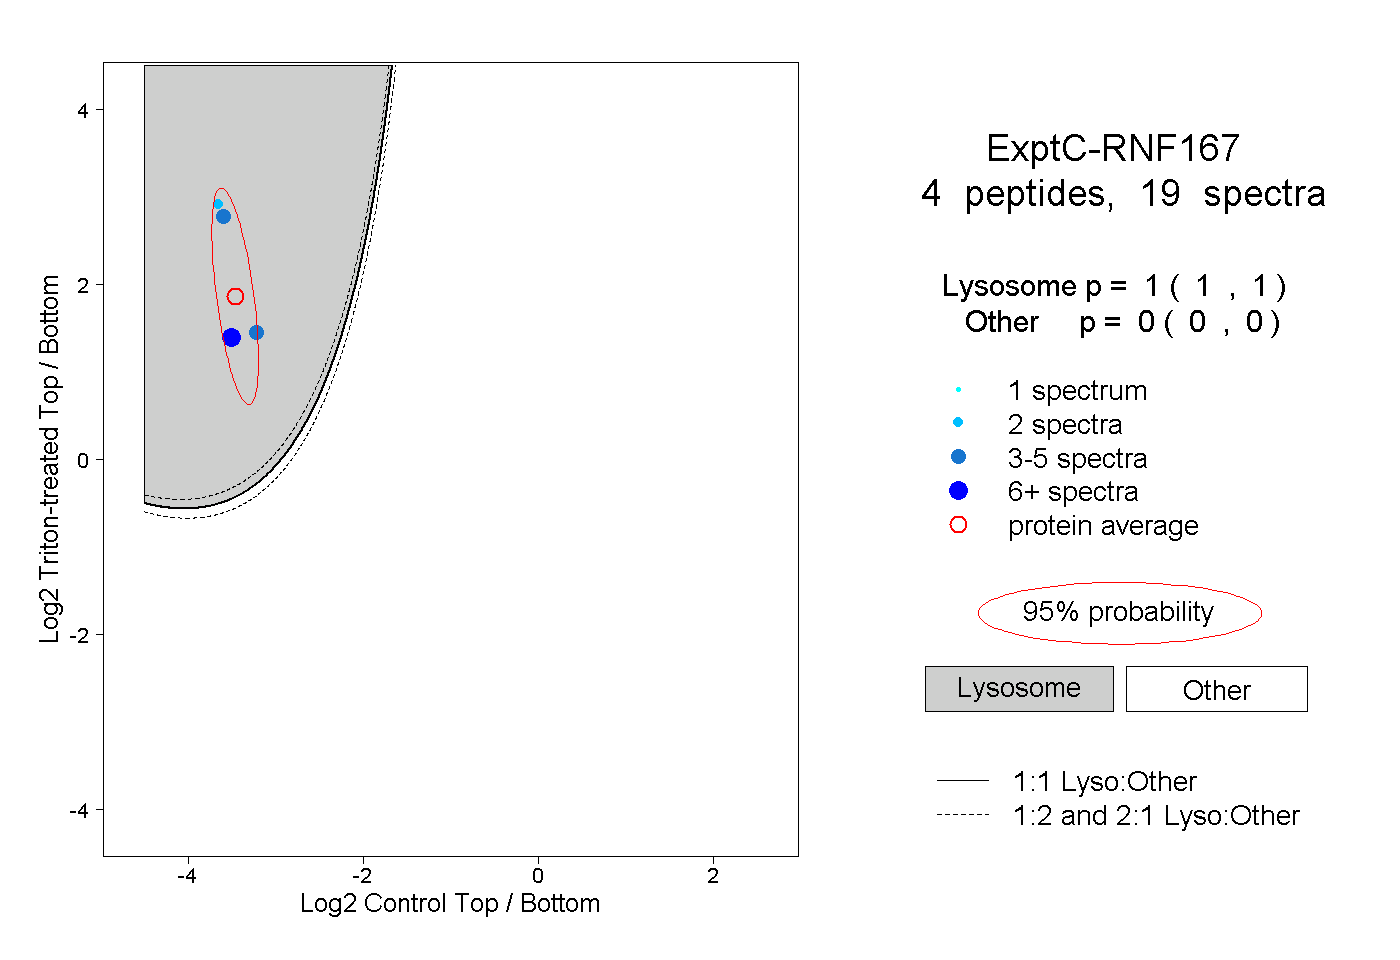
1.000 | 1.000
0.000 | 0.000
1peptide
spectrum
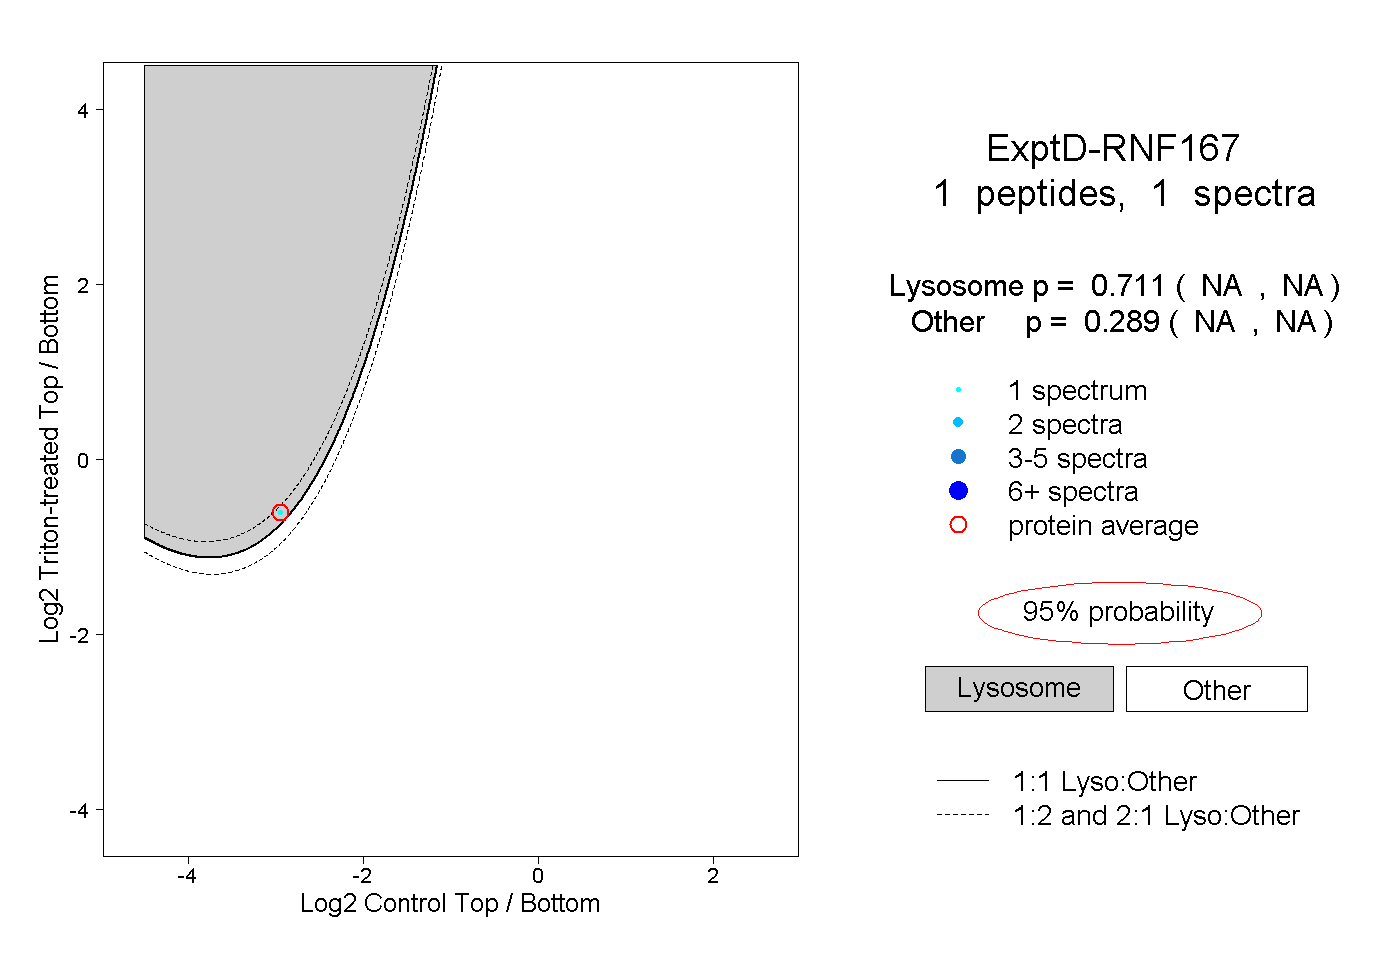
NA | NA
NA | NA