 5
5peptides
spectra
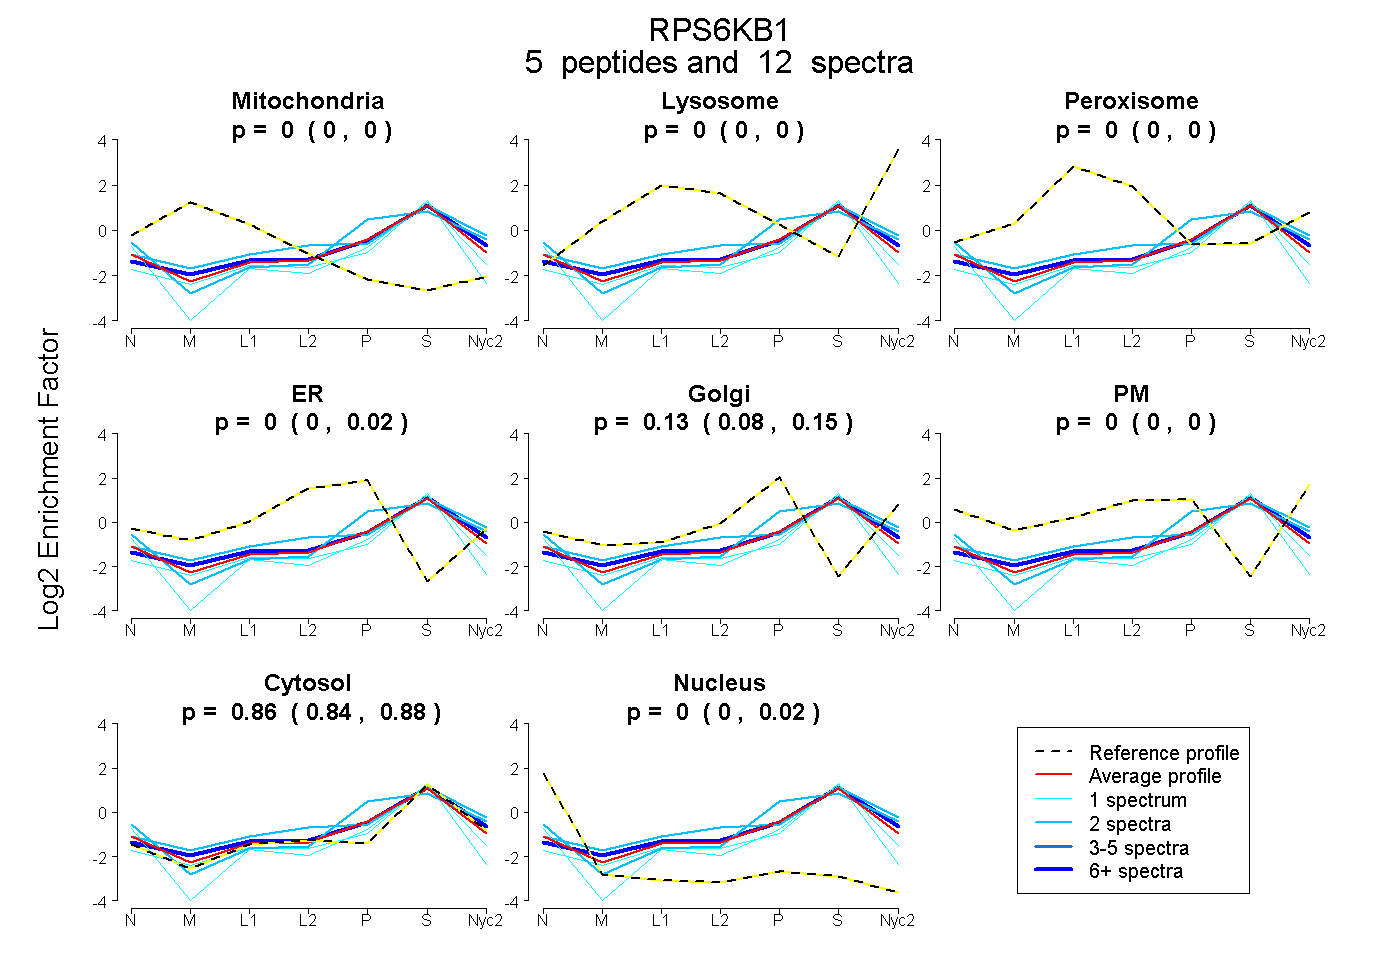
0.000 | 0.000
0.000 | 0.000
0.000 | 0.000
0.000 | 0.023
0.083 | 0.149
0.000 | 0.000
0.845 | 0.875
0.000 | 0.020
| Plot | Mito | Lyso | Perox | ER | Golgi | PM | Cytosol | Nucleus | |||||
| Expt A |
5 peptides |
12 spectra |
|
0.000 0.000 | 0.000 |
0.000 0.000 | 0.000 |
0.000 0.000 | 0.000 |
0.000 0.000 | 0.023 |
0.133 0.083 | 0.149 |
0.000 0.000 | 0.000 |
0.864 0.845 | 0.875 |
0.003 0.000 | 0.020 |
| 6 spectra, HINWEELLAR | 0.000 | 0.002 | 0.000 | 0.000 | 0.151 | 0.000 | 0.847 | 0.000 | ||
| 2 spectra, NILEEVK | 0.000 | 0.000 | 0.000 | 0.000 | 0.265 | 0.000 | 0.728 | 0.007 | ||
| 1 spectrum, TPVSPVK | 0.000 | 0.000 | 0.000 | 0.000 | 0.000 | 0.000 | 0.875 | 0.125 | ||
| 2 spectra, LGAGPGDAGEVQAHPFFR | 0.000 | 0.078 | 0.045 | 0.000 | 0.087 | 0.015 | 0.773 | 0.000 | ||
| 1 spectrum, IRPECFELLR | 0.000 | 0.000 | 0.000 | 0.000 | 0.000 | 0.000 | 0.918 | 0.082 |
| Plot | Lyso | Other | |||||||||||
| Expt C |
2 peptides |
2 spectra |
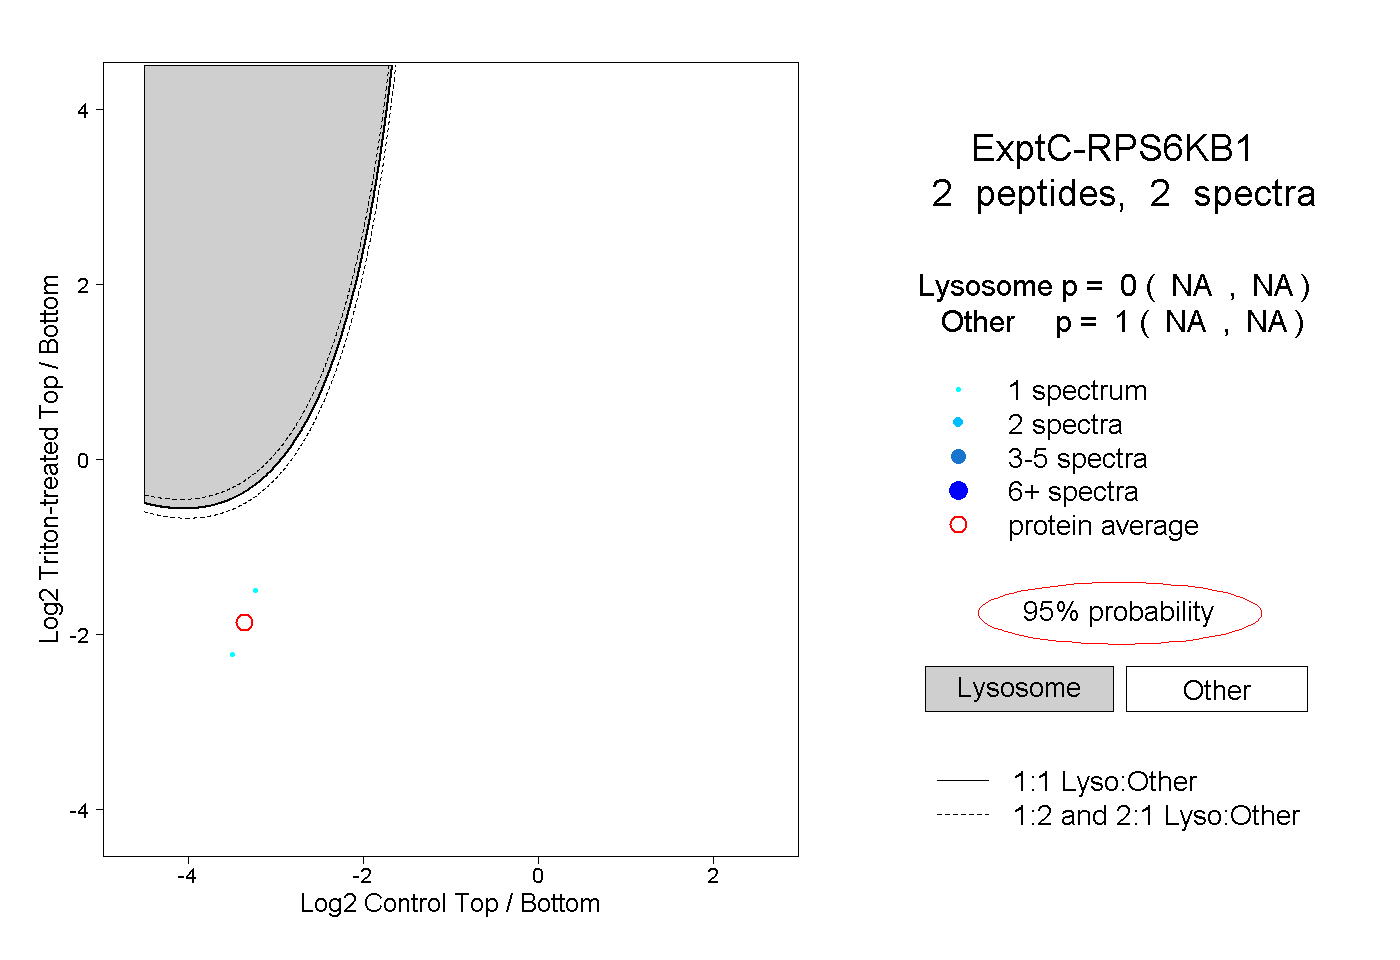 |
0.000 NA | NA |
1.000 NA | NA |