 2
2peptides
spectra
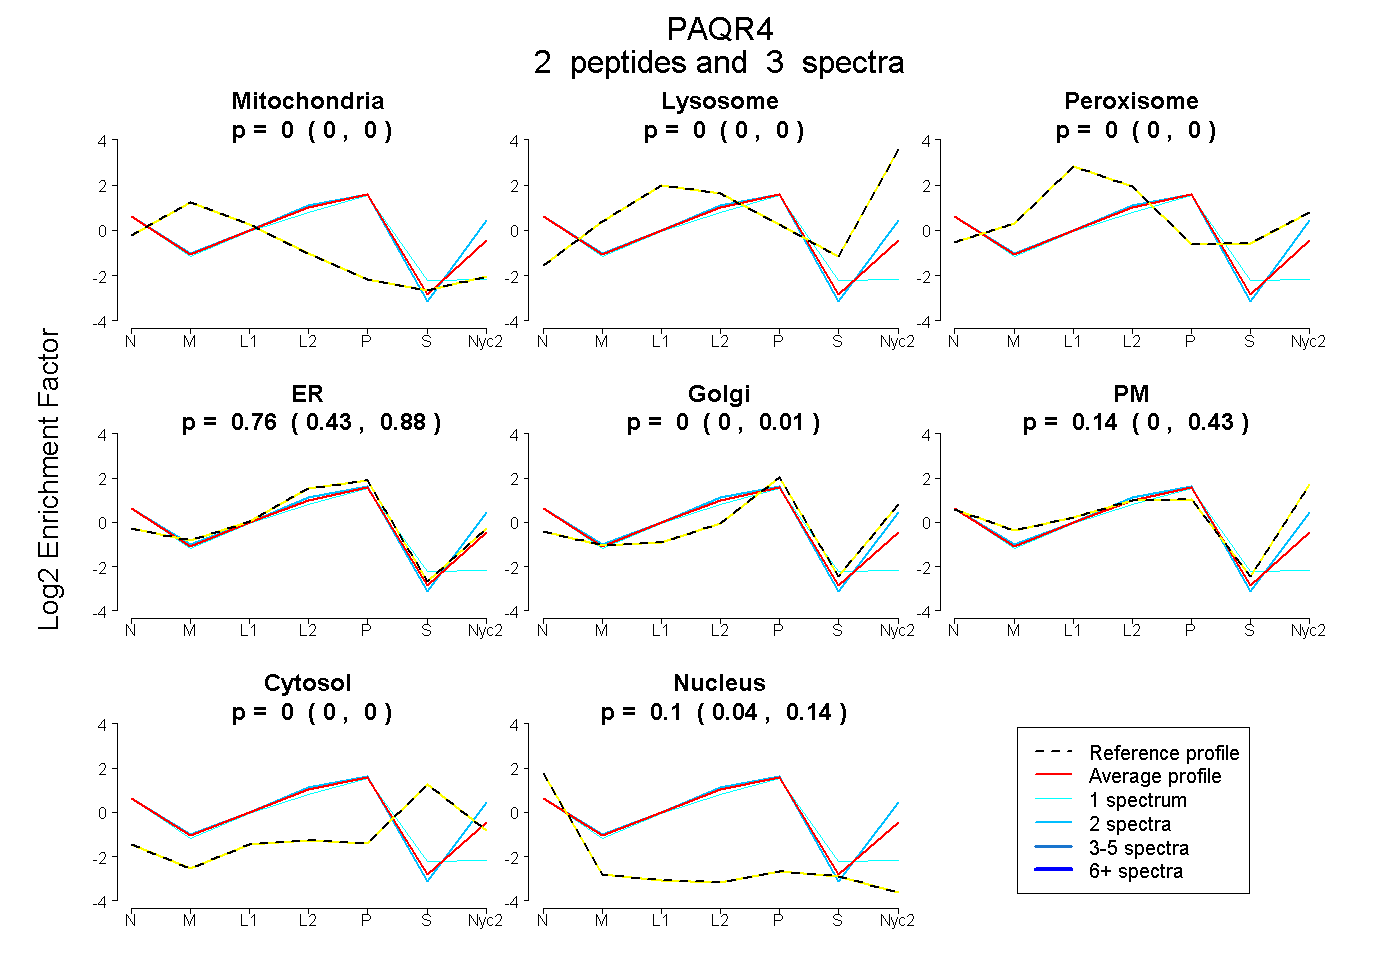
0.000 | 0.000
0.000 | 0.000
0.000 | 0.000
0.428 | 0.876
0.000 | 0.014
0.000 | 0.430
0.000 | 0.000
0.045 | 0.139
| Plot | Mito | Lyso | Perox | ER | Golgi | PM | Cytosol | Nucleus | |||||
| Expt A |
2 peptides |
3 spectra |
|
0.000 0.000 | 0.000 |
0.000 0.000 | 0.000 |
0.000 0.000 | 0.000 |
0.756 0.428 | 0.876 |
0.000 0.000 | 0.014 |
0.145 0.000 | 0.430 |
0.000 0.000 | 0.000 |
0.099 0.045 | 0.139 |
| 2 spectra, LLVFGAR | 0.000 | 0.000 | 0.000 | 0.535 | 0.000 | 0.416 | 0.000 | 0.049 | ||
| 1 spectrum, FVLTGYRPASSGSGCLR | 0.000 | 0.000 | 0.000 | 0.801 | 0.000 | 0.000 | 0.000 | 0.199 |