 1
1peptide
spectra
0.000 | 0.000
0.000 | 0.302
0.075 | 0.420
0.000 | 0.033
0.000 | 0.186
0.013 | 0.309
0.293 | 0.361
0.000 | 0.000
1peptide
spectra
0.000 | 0.000
1.000 | 1.000
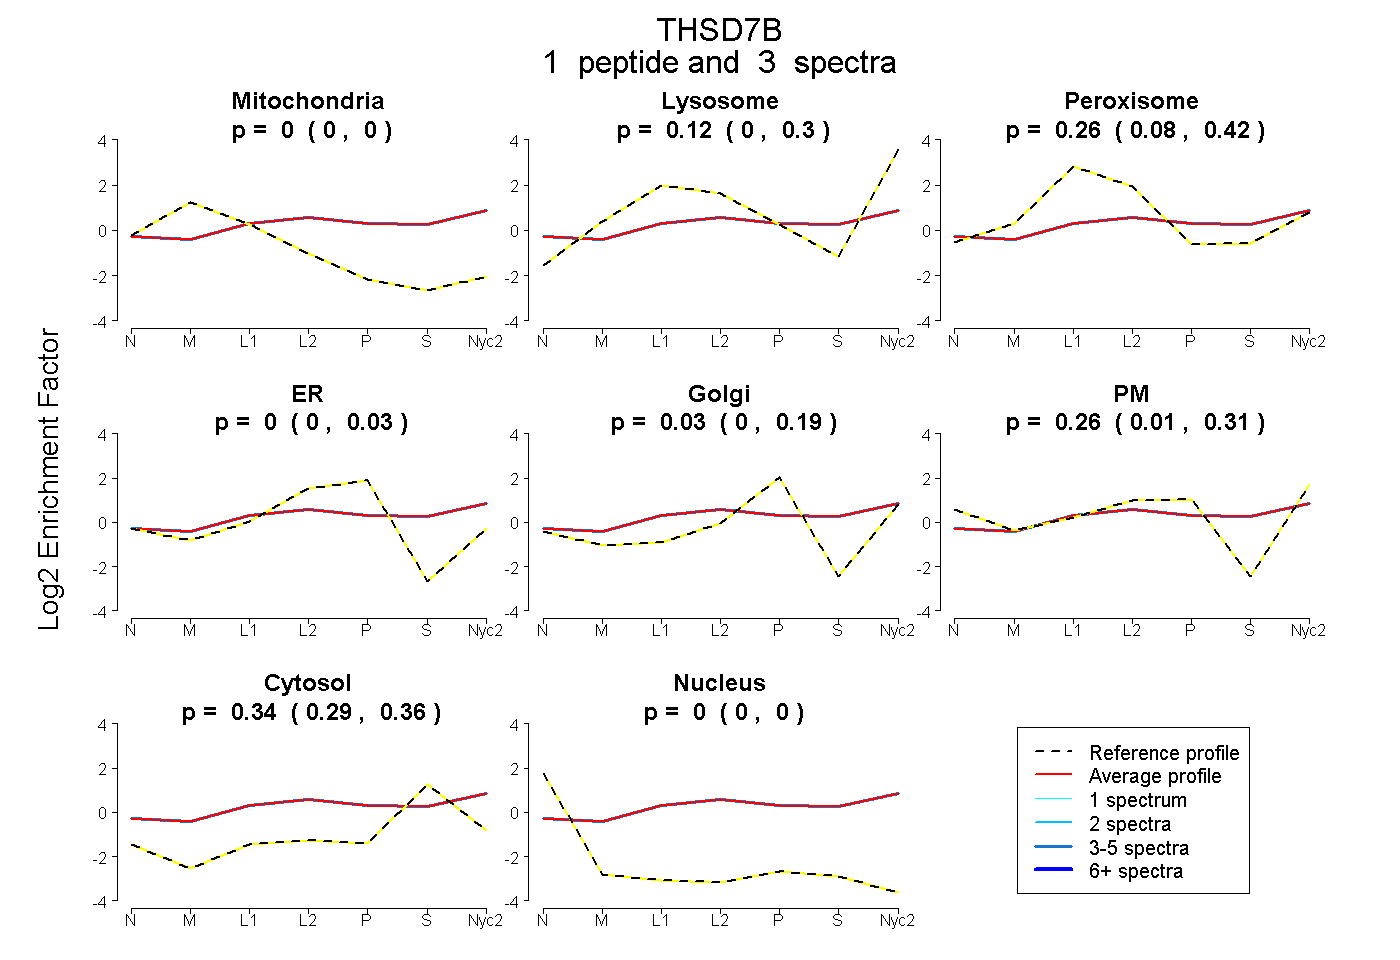
| Plot | Mito | Lyso | Perox | ER | Golgi | PM | Cytosol | Nucleus | |||||
| Expt A |
1 peptide |
3 spectra |
|
0.000 0.000 | 0.000 |
0.121 0.000 | 0.302 |
0.258 0.075 | 0.420 |
0.000 0.000 | 0.033 |
0.027 0.000 | 0.186 |
0.258 0.013 | 0.309 |
0.337 0.293 | 0.361 |
0.000 0.000 | 0.000 |
||
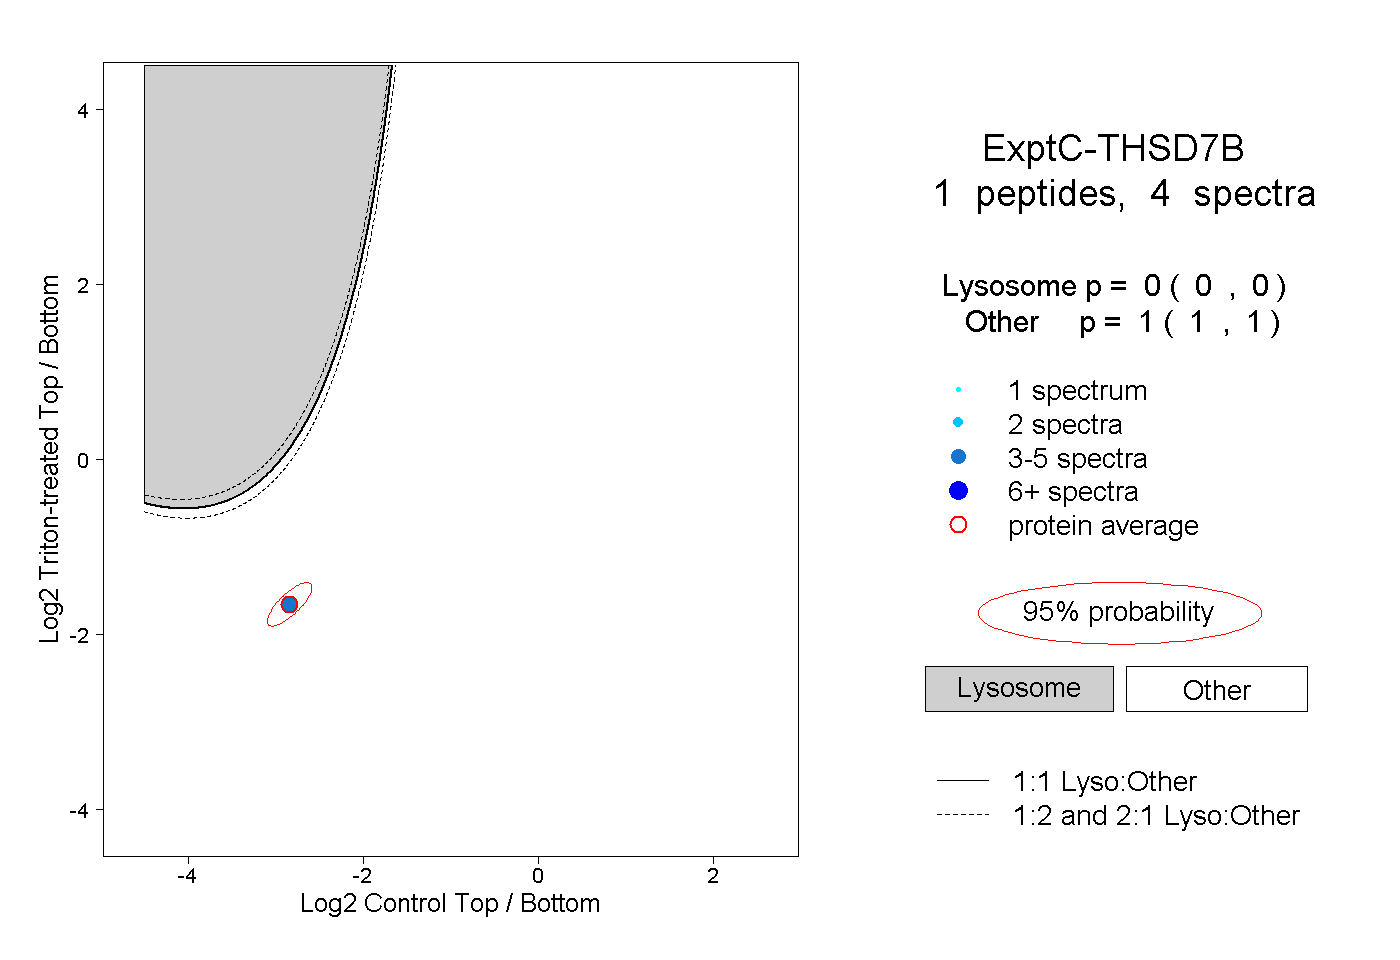
| Plot | Lyso | Other | |||||||||||
| Expt C |
1 peptide |
4 spectra |
|
0.000 0.000 | 0.000 |
1.000 1.000 | 1.000 |