 2
2peptides
spectra
0.034 | 0.181
0.000 | 0.000
0.000 | 0.000
0.000 | 0.218
0.000 | 0.335
0.000 | 0.183
0.162 | 0.341
0.271 | 0.407
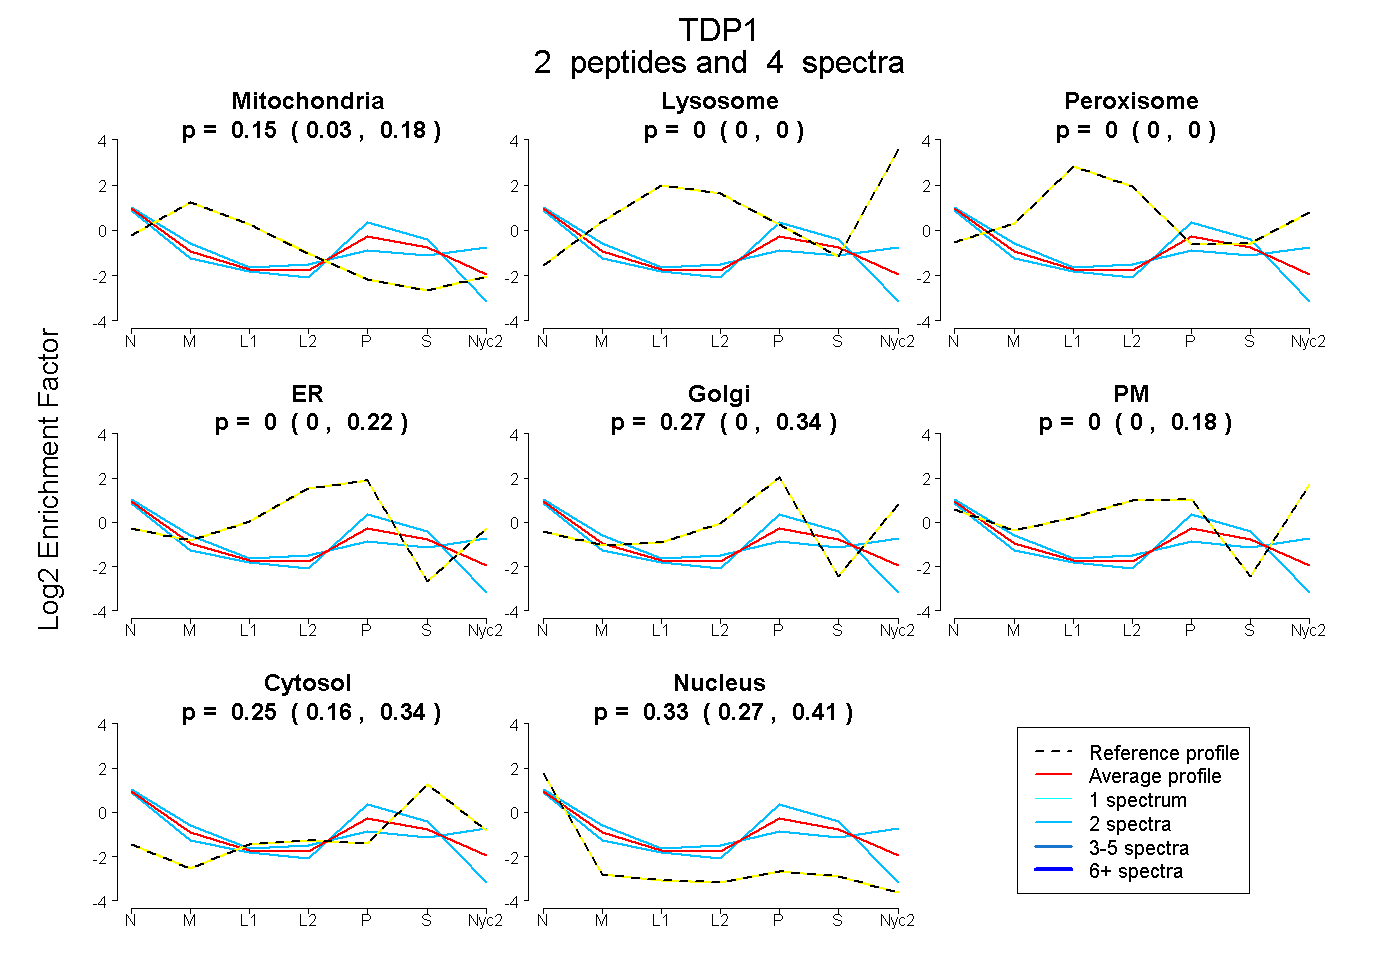
| Plot | Mito | Lyso | Perox | ER | Golgi | PM | Cytosol | Nucleus | |||||
| Expt A |
2 peptides |
4 spectra |
|
0.145 0.034 | 0.181 |
0.000 0.000 | 0.000 |
0.000 0.000 | 0.000 |
0.000 0.000 | 0.218 |
0.271 0.000 | 0.335 |
0.000 0.000 | 0.183 |
0.255 0.162 | 0.341 |
0.329 0.271 | 0.407 |