 4
4peptides
spectra
0.000 | 0.000
0.023 | 0.323
0.016 | 0.348
0.000 | 0.423
0.000 | 0.248
0.000 | 0.257
0.145 | 0.329
0.000 | 0.000
2peptides
spectra
0.000 | 0.000
1.000 | 1.000
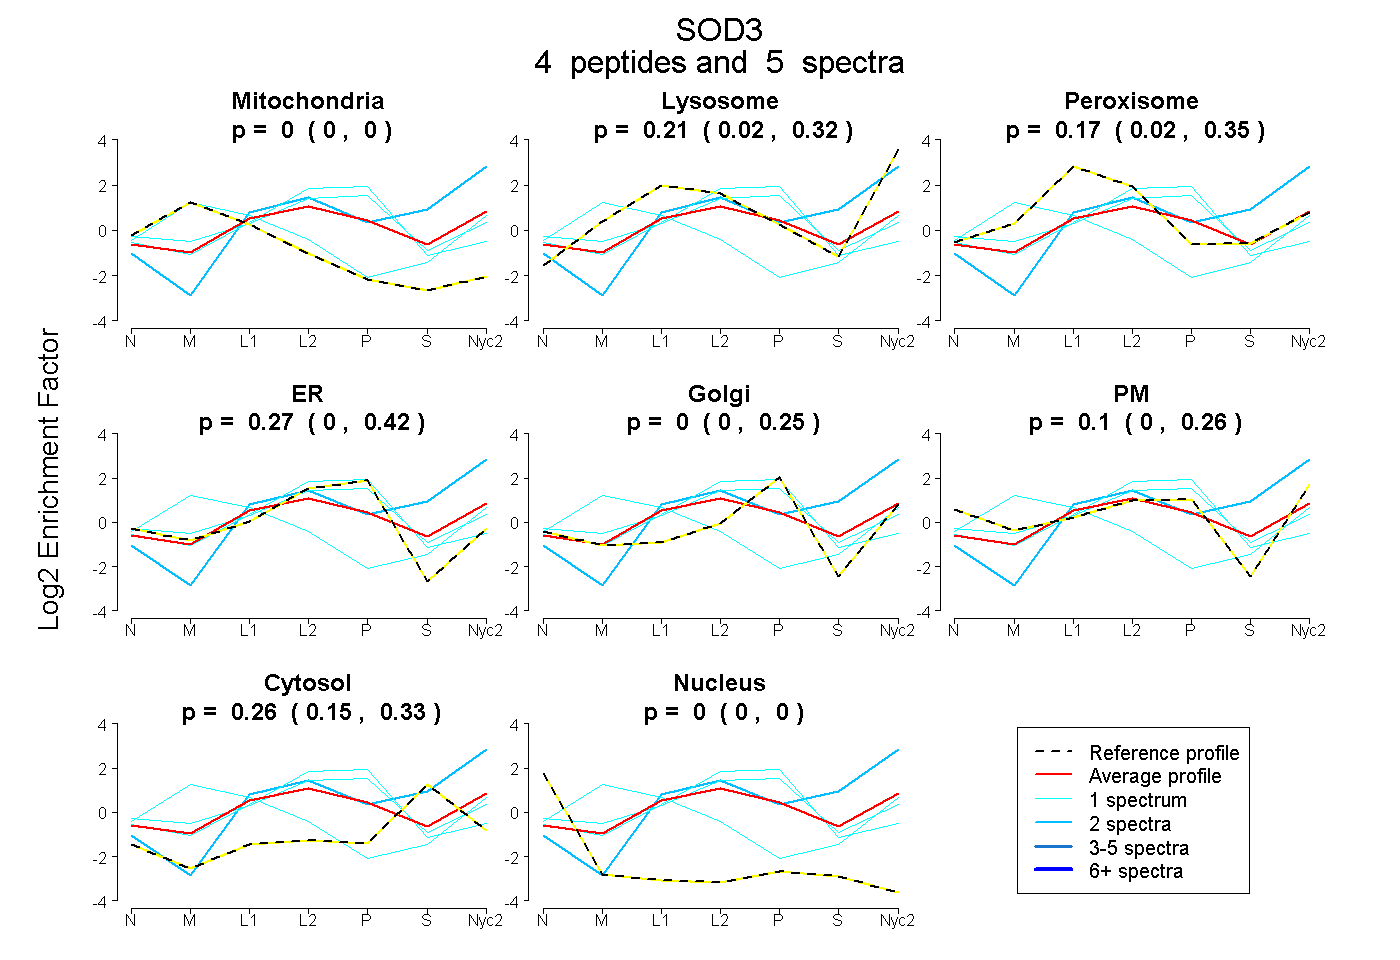
| Plot | Mito | Lyso | Perox | ER | Golgi | PM | Cytosol | Nucleus | |||||
| Expt A |
4 peptides |
5 spectra |
|
0.000 0.000 | 0.000 |
0.206 0.023 | 0.323 |
0.168 0.016 | 0.348 |
0.267 0.000 | 0.423 |
0.000 0.000 | 0.248 |
0.099 0.000 | 0.257 |
0.259 0.145 | 0.329 |
0.000 0.000 | 0.000 |
||
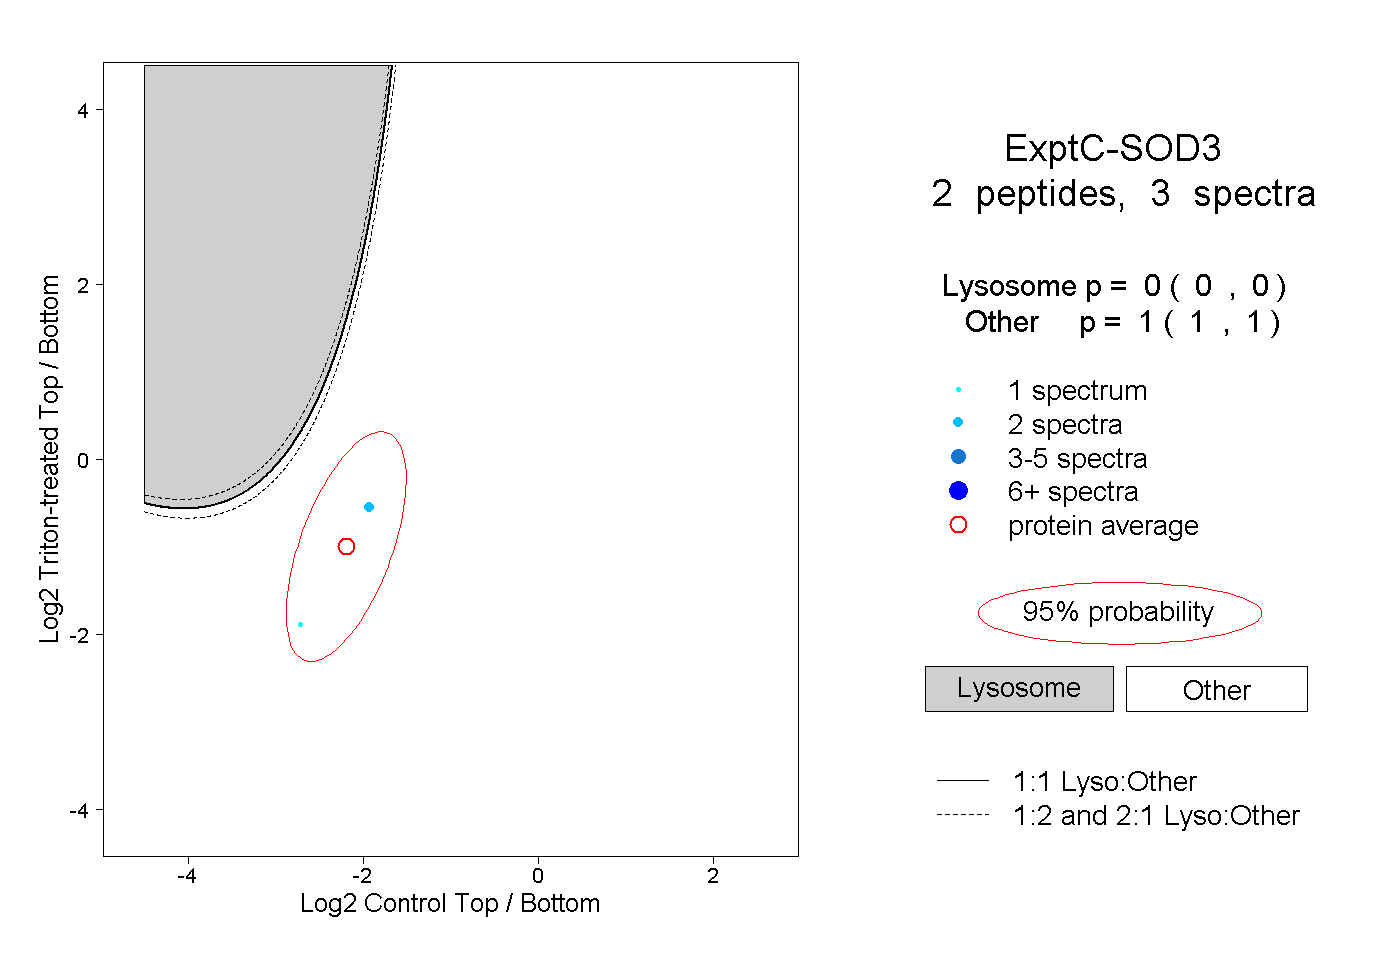
| Plot | Lyso | Other | |||||||||||
| Expt C |
2 peptides |
3 spectra |
|
0.000 0.000 | 0.000 |
1.000 1.000 | 1.000 |