17
17peptides
spectra
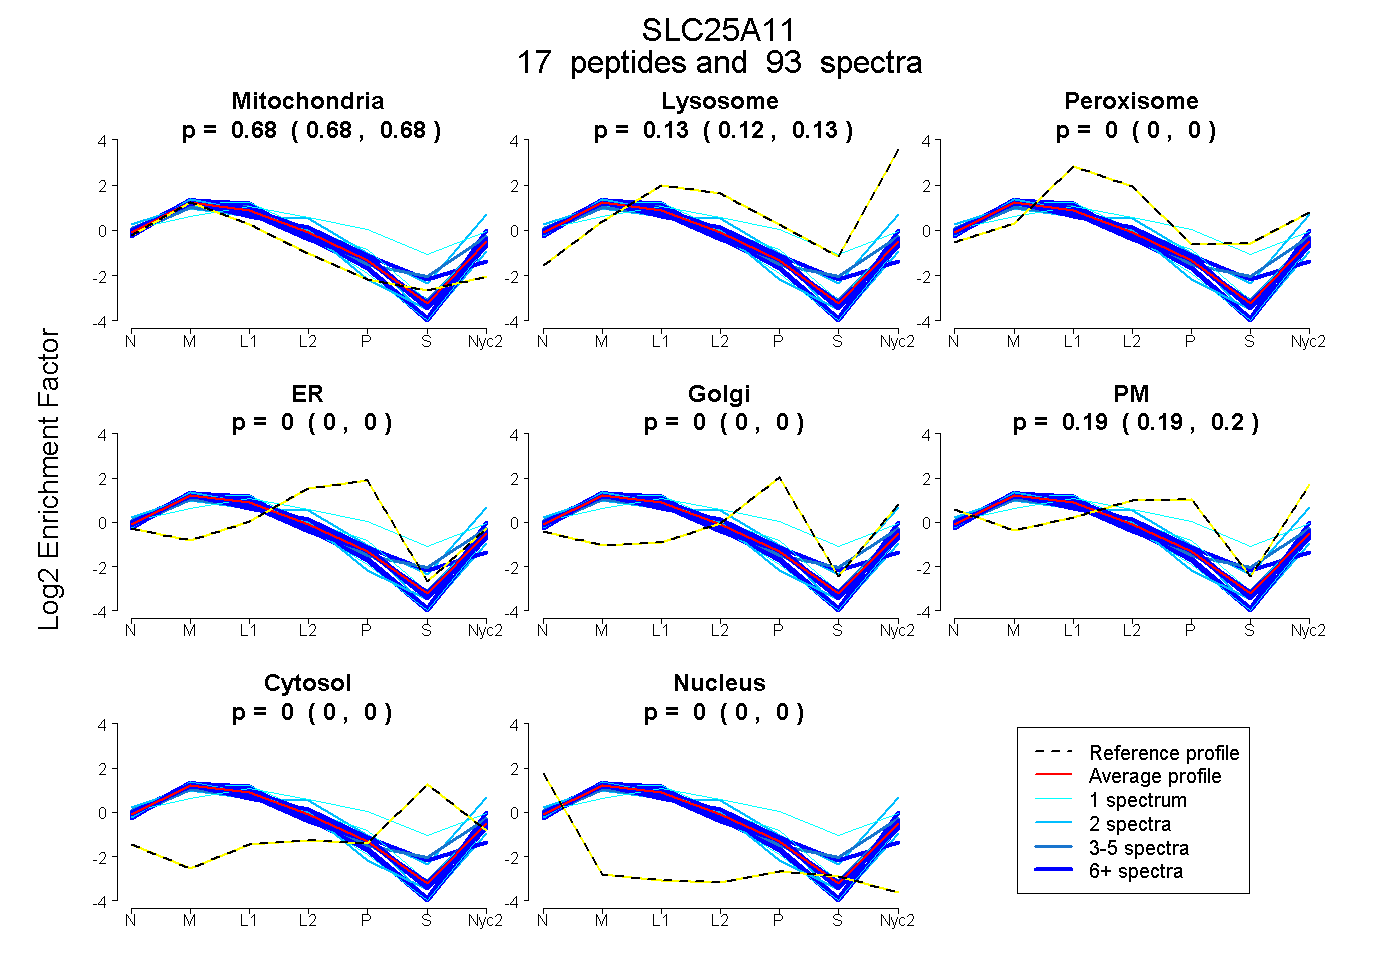
0.679 | 0.684
0.122 | 0.131
0.000 | 0.000
0.000 | 0.000
0.000 | 0.000
0.187 | 0.195
0.000 | 0.000
0.000 | 0.000
13peptides
spectra
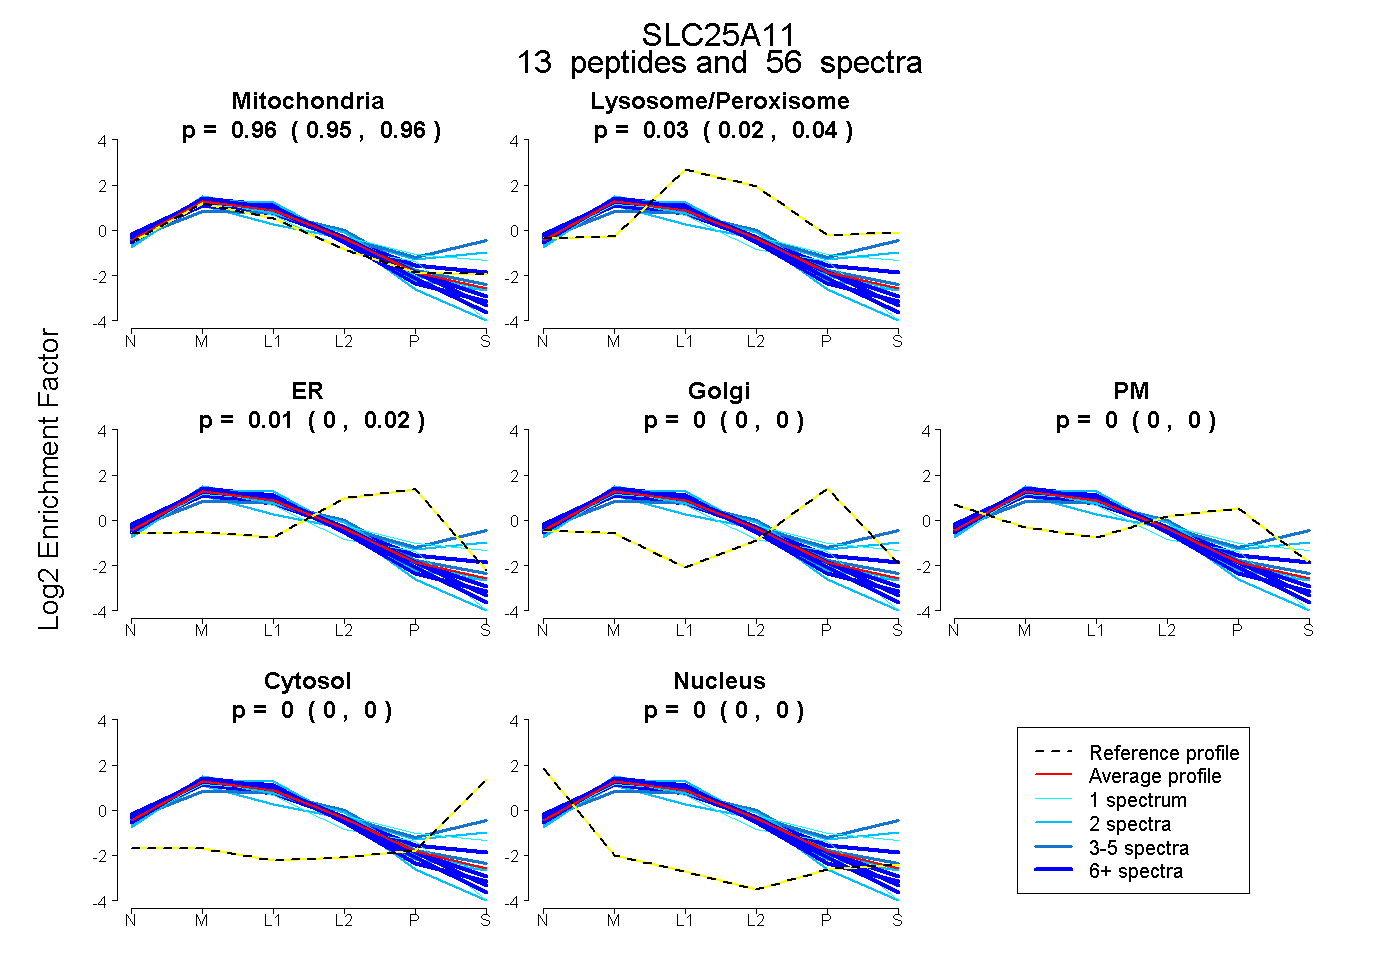
0.949 | 0.963
0.022 | 0.041
0.002 | 0.018
0.000 | 0.000
0.000 | 0.000
0.000 | 0.000
0.000 | 0.000