 2
2peptides
spectra
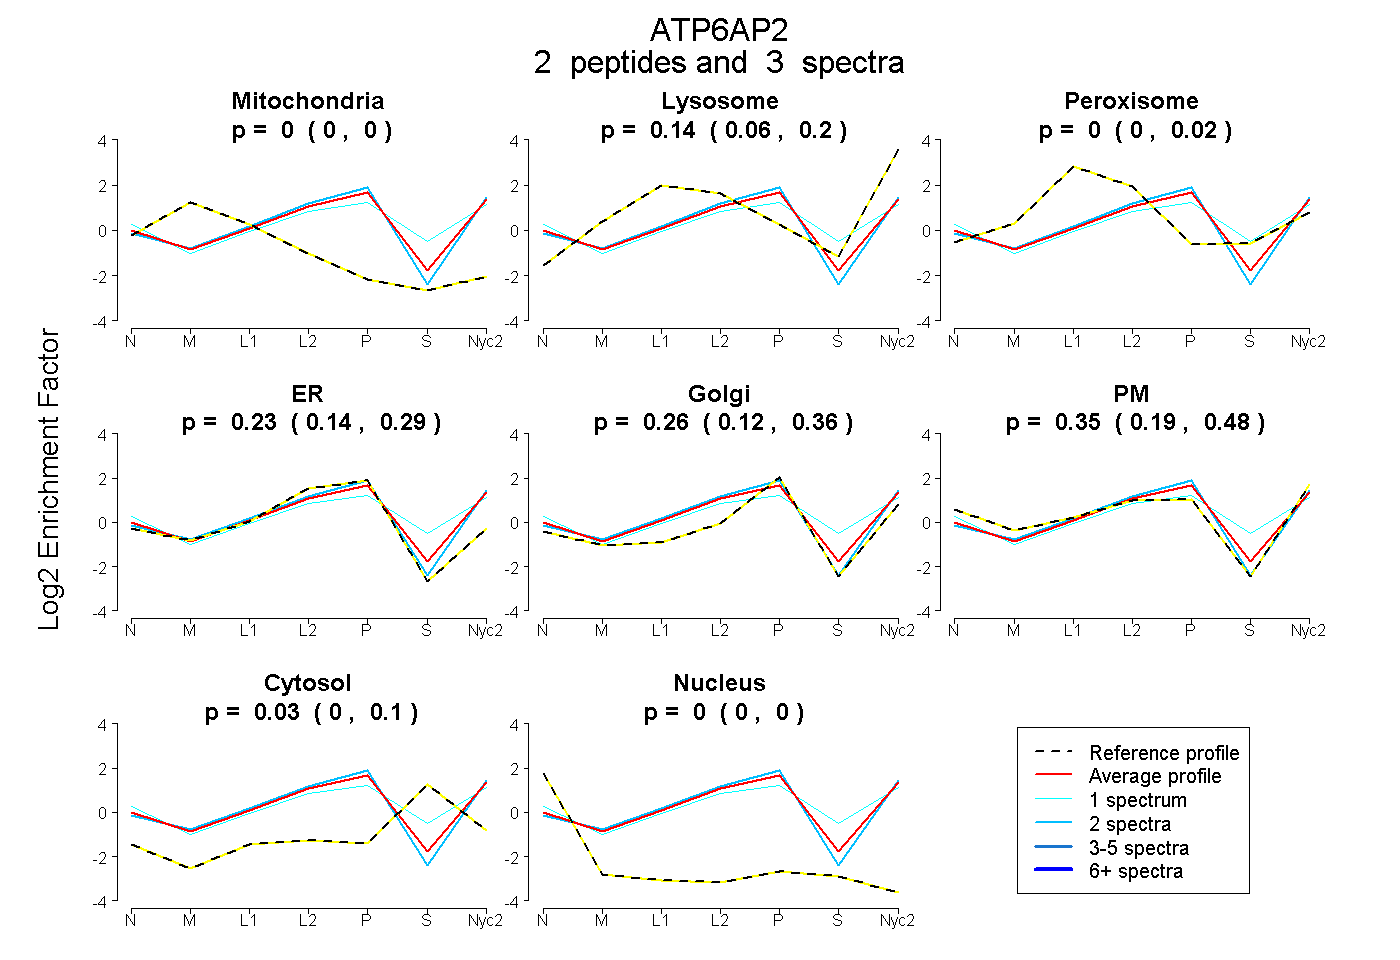
0.000 | 0.000
0.056 | 0.199
0.000 | 0.025
0.139 | 0.286
0.122 | 0.363
0.189 | 0.481
0.000 | 0.102
0.000 | 0.000
4peptides
spectra
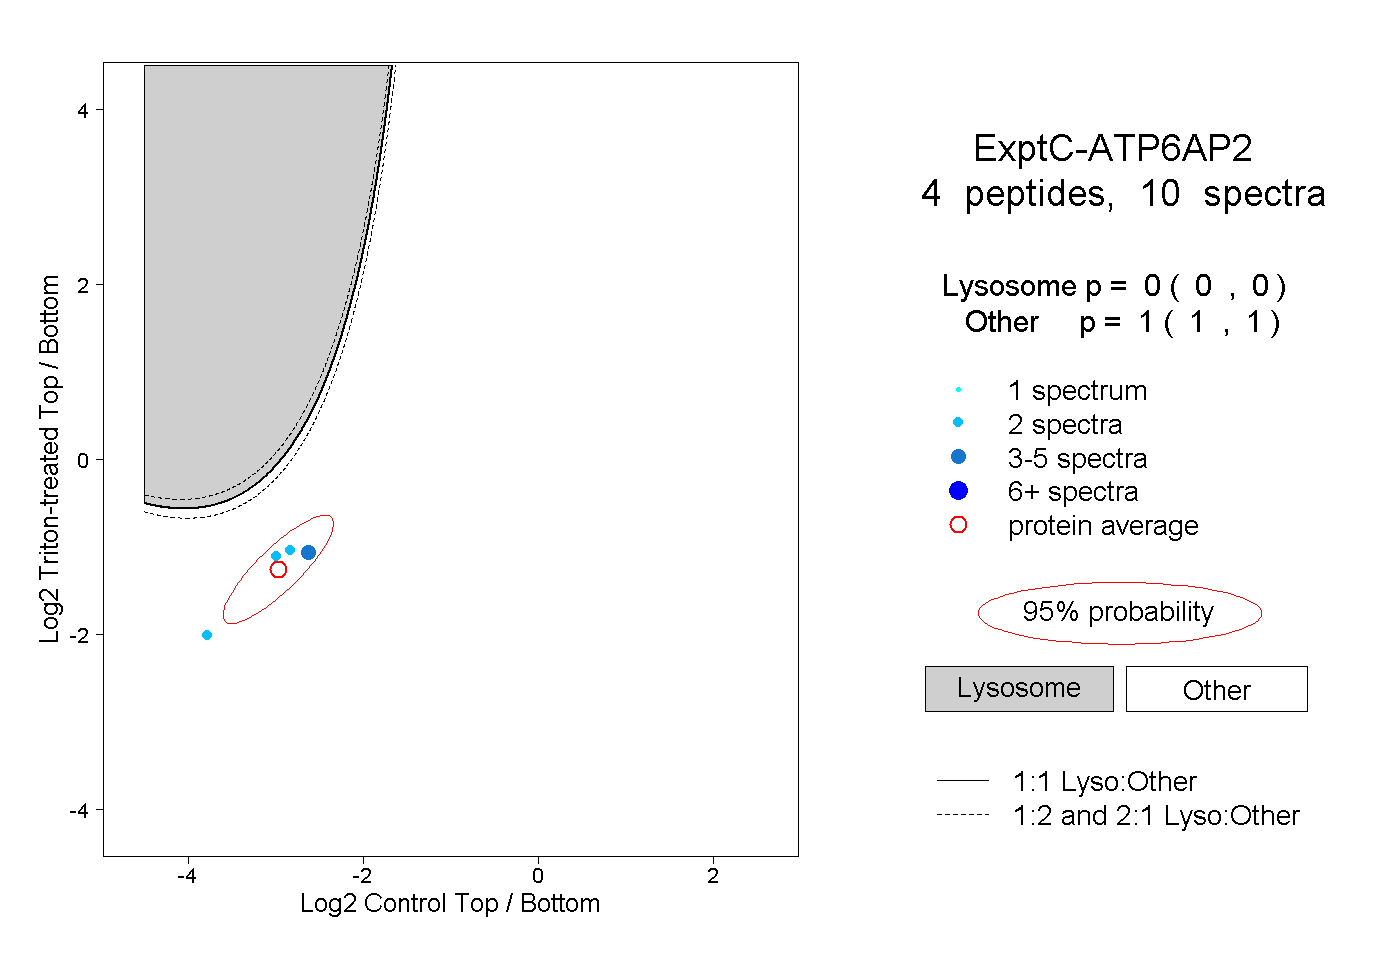
0.000 | 0.000
1.000 | 1.000
| Plot | Mito | Lyso | Perox | ER | Golgi | PM | Cytosol | Nucleus | |||||
| Expt A |
2 peptides |
3 spectra |
|
0.000 0.000 | 0.000 |
0.141 0.056 | 0.199 |
0.000 0.000 | 0.025 |
0.225 0.139 | 0.286 |
0.257 0.122 | 0.363 |
0.346 0.189 | 0.481 |
0.030 0.000 | 0.102 |
0.000 0.000 | 0.000 |
||
| Plot | Lyso | Other | |||||||||||
| Expt C |
4 peptides |
10 spectra |
|
0.000 0.000 | 0.000 |
1.000 1.000 | 1.000 |