23
23peptides
spectra
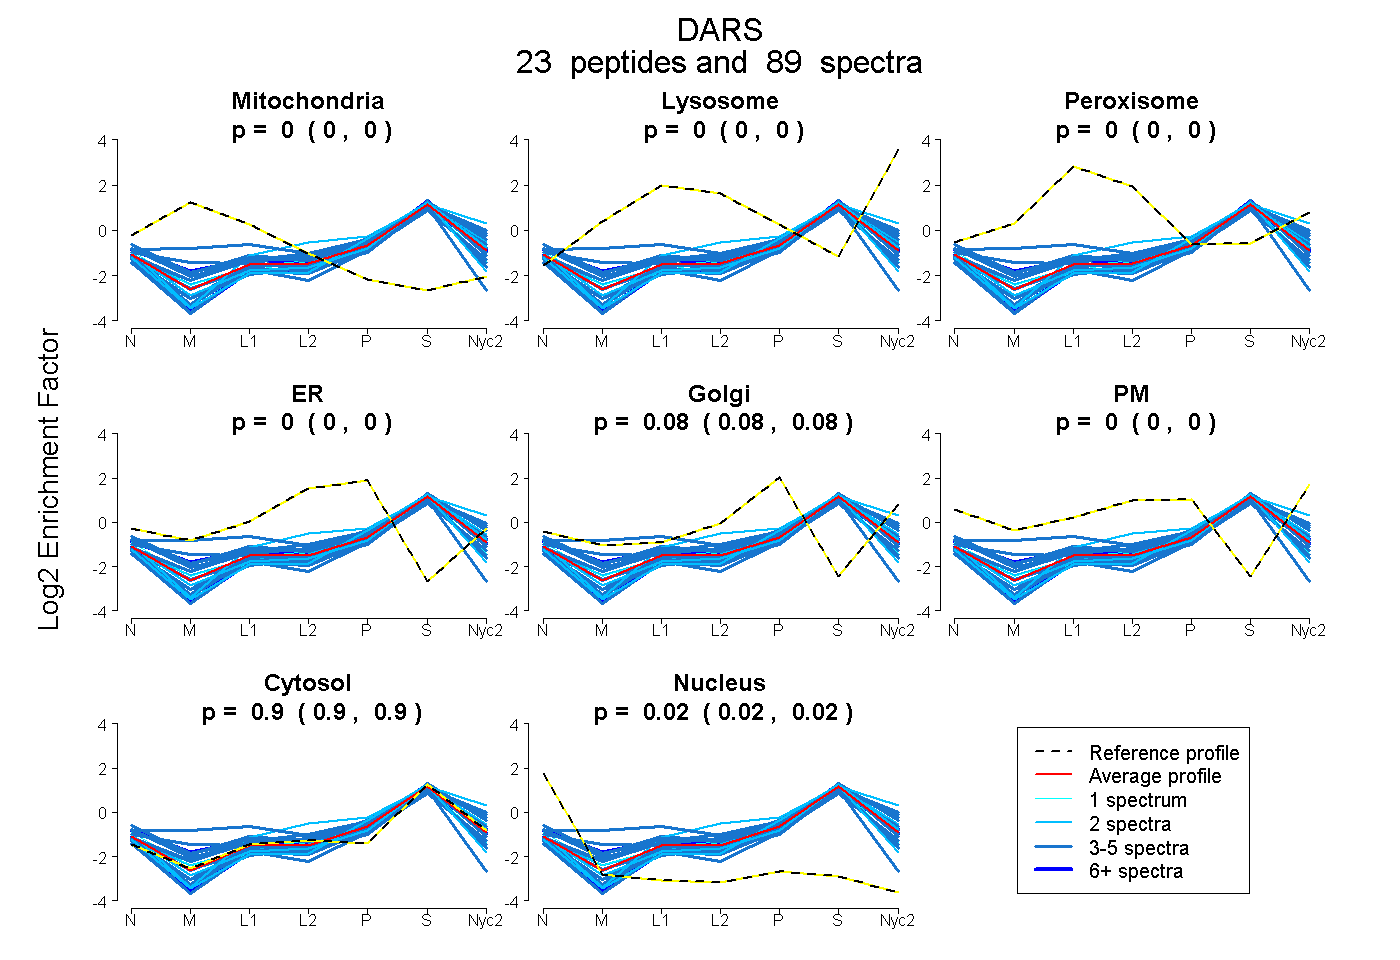
0.000 | 0.000
0.000 | 0.000
0.000 | 0.000
0.000 | 0.000
0.076 | 0.082
0.000 | 0.000
0.900 | 0.903
0.016 | 0.021
15peptides
spectra
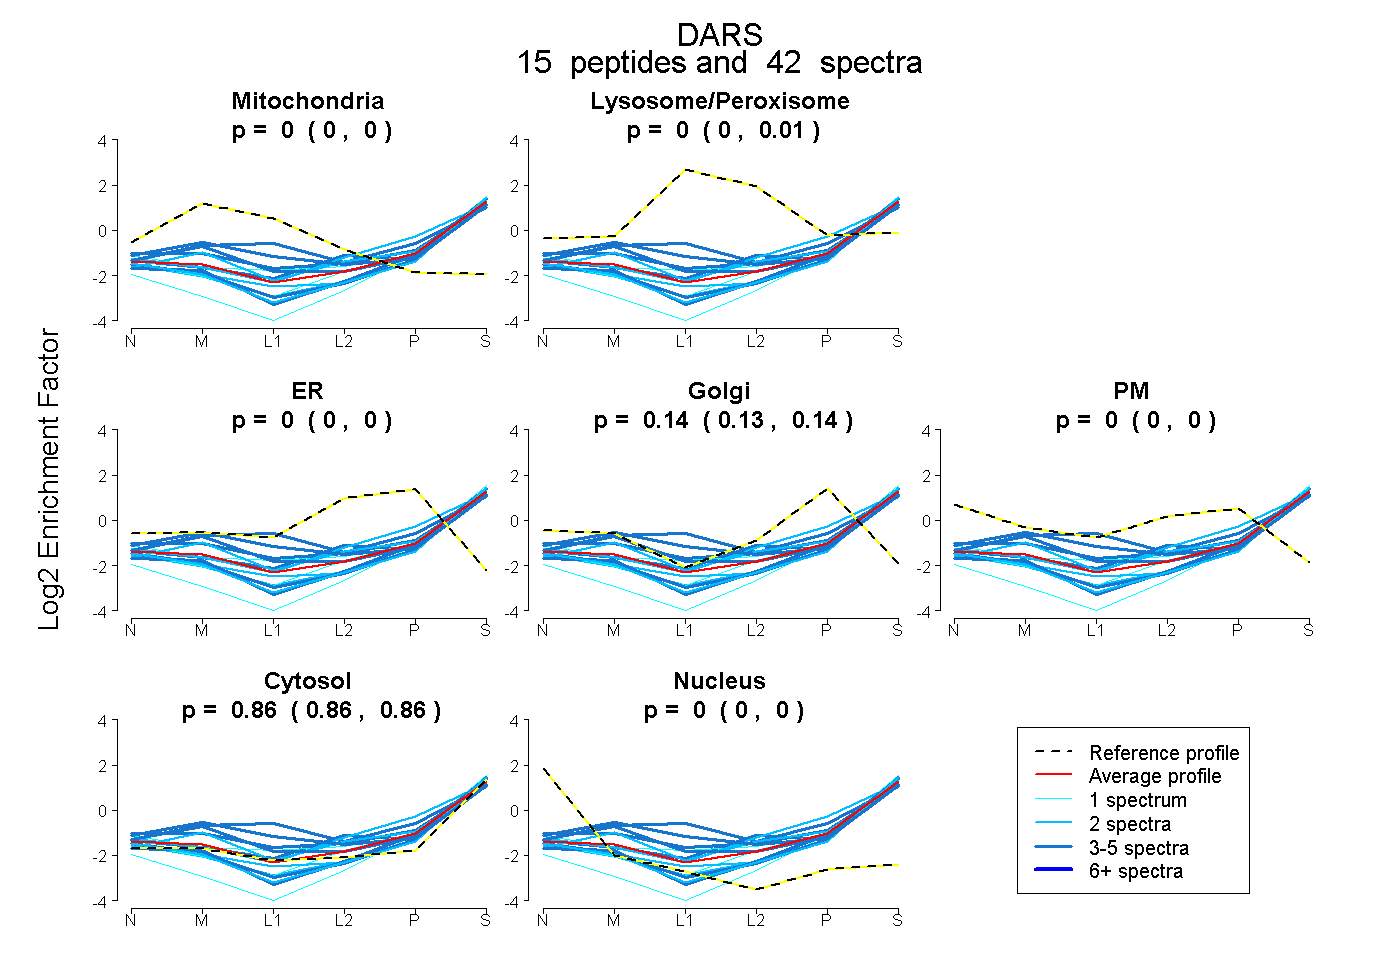
0.000 | 0.000
0.000 | 0.008
0.000 | 0.000
0.131 | 0.142
0.000 | 0.000
0.855 | 0.865
0.000 | 0.000