 23
23peptides
spectra
0.000 | 0.000
0.000 | 0.000
0.000 | 0.000
0.000 | 0.000
0.076 | 0.082
0.000 | 0.000
0.900 | 0.903
0.016 | 0.021
| Plot | Mito | Lyso | Perox | ER | Golgi | PM | Cytosol | Nucleus | |||||
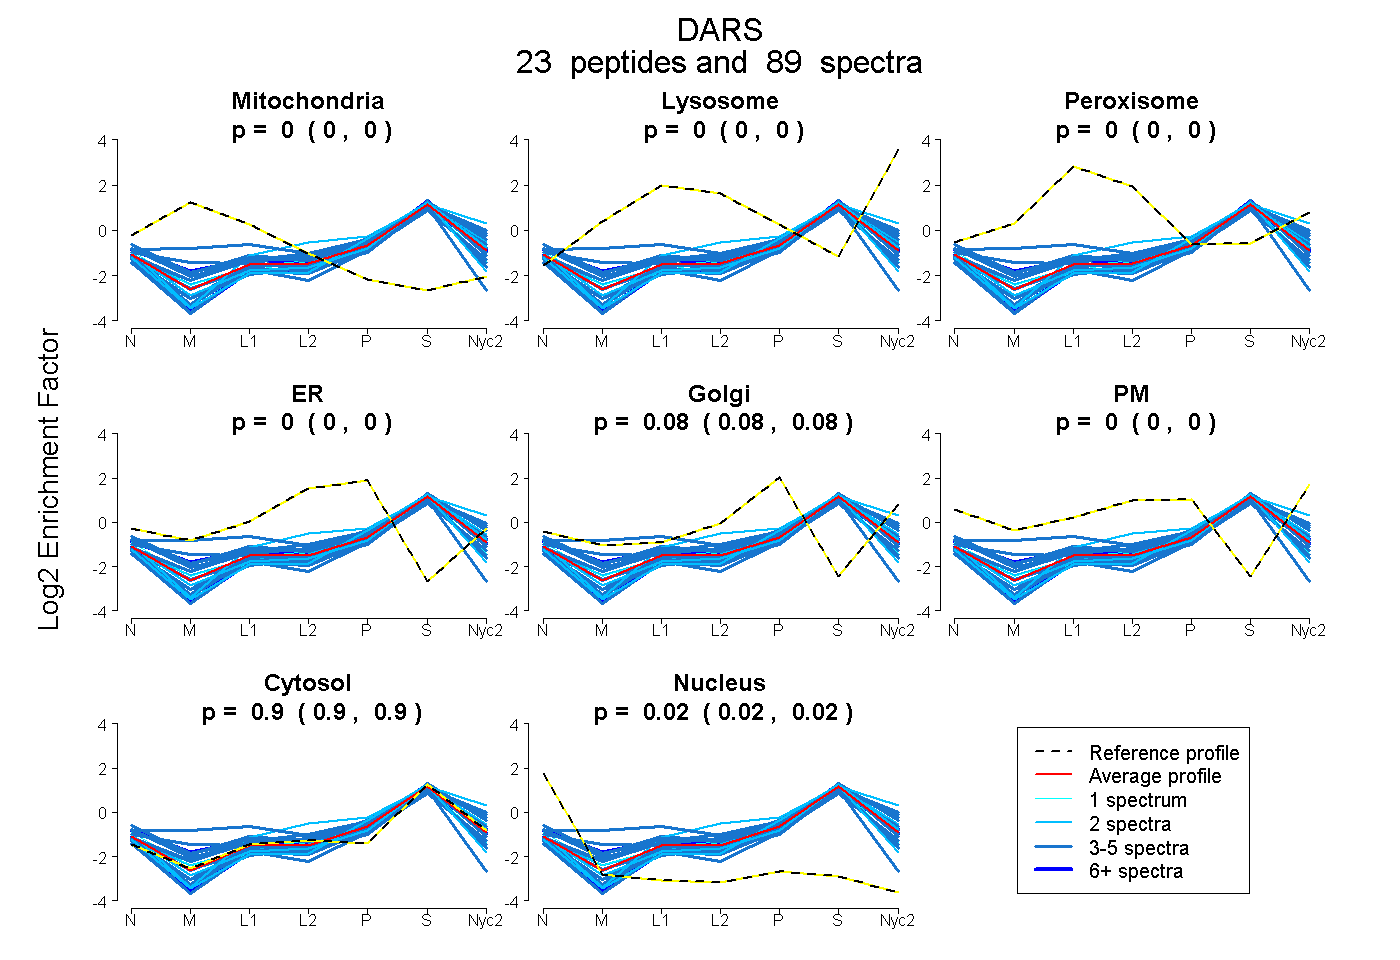
| Expt A |
23 peptides |
89 spectra |
|
0.000 0.000 | 0.000 |
0.000 0.000 | 0.000 |
0.000 0.000 | 0.000 |
0.000 0.000 | 0.000 |
0.079 0.076 | 0.082 |
0.000 0.000 | 0.000 |
0.902 0.900 | 0.903 |
0.019 0.016 | 0.021 |
| 2 spectra, PSANASR | 0.000 | 0.064 | 0.000 | 0.000 | 0.133 | 0.000 | 0.803 | 0.000 | ||
| 2 spectra, VFCIGPVFR | 0.000 | 0.000 | 0.000 | 0.000 | 0.000 | 0.000 | 0.889 | 0.111 | ||
| 3 spectra, FGAPPHAGGGIGLER | 0.000 | 0.000 | 0.000 | 0.000 | 0.092 | 0.048 | 0.845 | 0.014 | ||
| 4 spectra, ESIIDVEGIVR | 0.000 | 0.000 | 0.000 | 0.000 | 0.000 | 0.000 | 0.969 | 0.031 | ||
| 4 spectra, QTSMFPR | 0.000 | 0.021 | 0.000 | 0.000 | 0.153 | 0.000 | 0.826 | 0.000 | ||
| 3 spectra, ADEVVWVR | 0.000 | 0.000 | 0.000 | 0.000 | 0.000 | 0.000 | 0.953 | 0.047 | ||
| 3 spectra, ALHHGIDLEK | 0.000 | 0.000 | 0.000 | 0.049 | 0.000 | 0.000 | 0.889 | 0.062 | ||
| 1 spectrum, FAANINK | 0.000 | 0.000 | 0.000 | 0.000 | 0.038 | 0.000 | 0.934 | 0.028 | ||
| 9 spectra, AYIDSFR | 0.050 | 0.000 | 0.000 | 0.000 | 0.131 | 0.000 | 0.819 | 0.000 | ||
| 5 spectra, QSNSYDMFMR | 0.000 | 0.051 | 0.000 | 0.000 | 0.115 | 0.000 | 0.834 | 0.000 | ||
| 4 spectra, IYVISLAEPR | 0.000 | 0.000 | 0.000 | 0.000 | 0.007 | 0.000 | 0.949 | 0.044 | ||
| 4 spectra, FLEPTLR | 0.000 | 0.039 | 0.000 | 0.000 | 0.023 | 0.118 | 0.819 | 0.000 | ||
| 5 spectra, QFPCEPFK | 0.210 | 0.000 | 0.105 | 0.010 | 0.000 | 0.000 | 0.676 | 0.000 | ||
| 1 spectrum, IGSCTQQDVELHVQK | 0.000 | 0.000 | 0.000 | 0.060 | 0.000 | 0.000 | 0.880 | 0.059 | ||
| 2 spectra, YGVSSMIQSQEKPDR | 0.000 | 0.000 | 0.000 | 0.000 | 0.041 | 0.000 | 0.932 | 0.027 | ||
| 3 spectra, GEEILSGAQR | 0.000 | 0.000 | 0.000 | 0.000 | 0.055 | 0.000 | 0.944 | 0.000 | ||
| 2 spectra, FQTEIQTVNK | 0.000 | 0.000 | 0.000 | 0.000 | 0.116 | 0.000 | 0.884 | 0.000 | ||
| 4 spectra, QCFLVLR | 0.143 | 0.000 | 0.000 | 0.000 | 0.000 | 0.000 | 0.754 | 0.103 | ||
| 5 spectra, LEYCEALAMLR | 0.000 | 0.000 | 0.000 | 0.000 | 0.038 | 0.000 | 0.962 | 0.000 | ||
| 4 spectra, LPLQLDDAIRPEVEGEEDGR | 0.000 | 0.000 | 0.000 | 0.000 | 0.026 | 0.000 | 0.931 | 0.043 | ||
| 4 spectra, IHDPQLLTER | 0.000 | 0.000 | 0.000 | 0.000 | 0.120 | 0.087 | 0.791 | 0.002 | ||
| 12 spectra, ATVNQDTR | 0.000 | 0.000 | 0.000 | 0.000 | 0.000 | 0.000 | 0.951 | 0.049 | ||
| 3 spectra, EIVDAAEDYAK | 0.000 | 0.000 | 0.000 | 0.000 | 0.000 | 0.000 | 0.897 | 0.103 |
| Plot | Mito | Lyso or Perox | ER | Golgi | PM | Cytosol | Nucleus | ||||||
| Expt B |
15 peptides |
42 spectra |
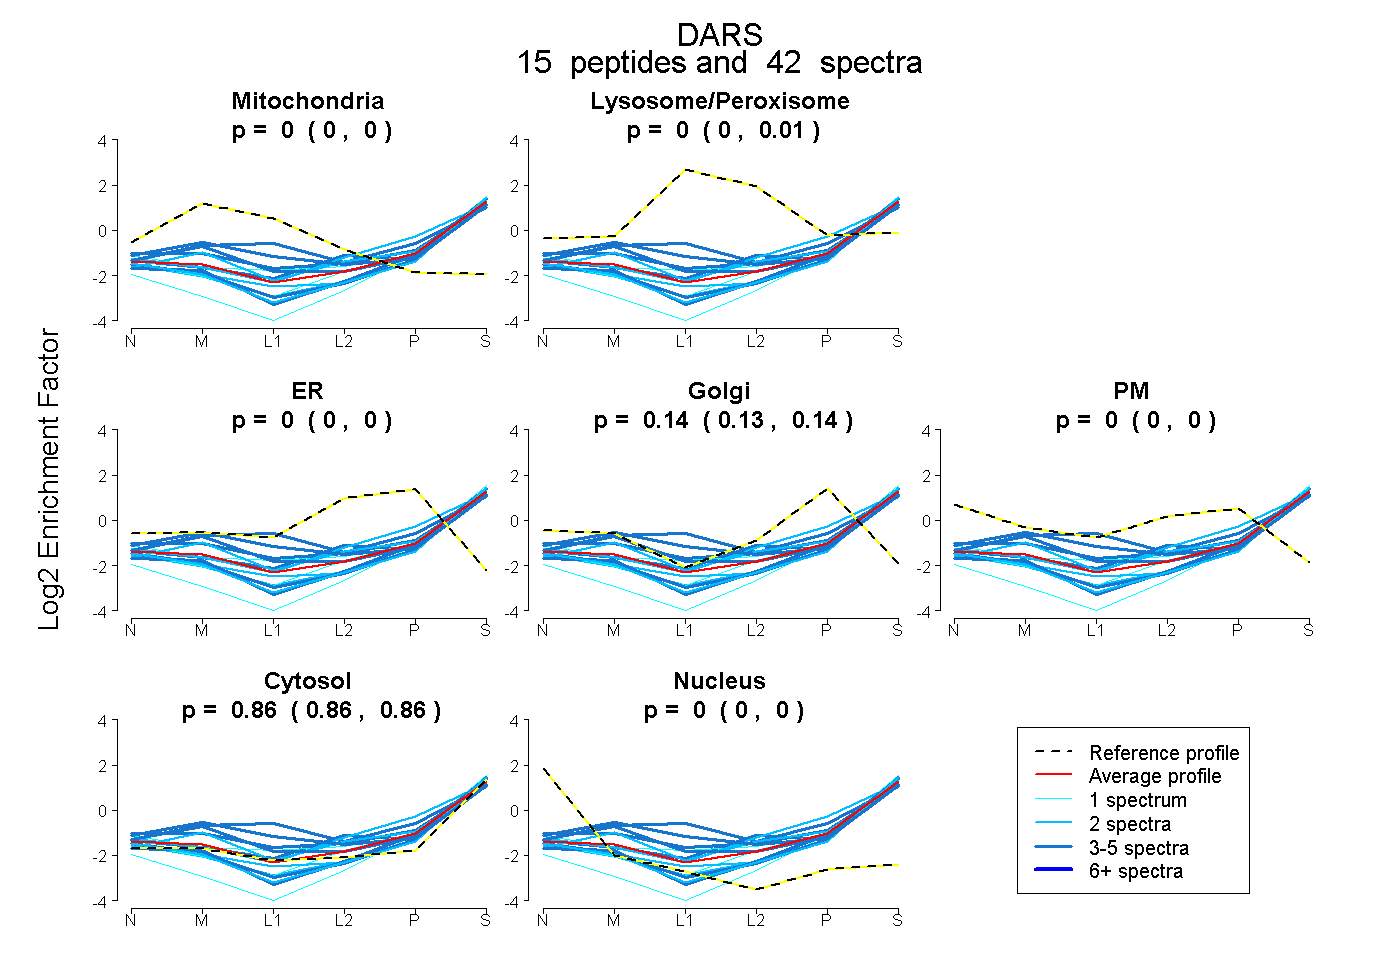 |
0.000 0.000 | 0.000 |
0.000 0.000 | 0.008 |
0.000 0.000 | 0.000 |
0.139 0.131 | 0.142 |
0.000 0.000 | 0.000 |
0.861 0.855 | 0.865 |
0.000 0.000 | 0.000 |
|||
| Plot | Lyso | Other | |||||||||||
| Expt C |
20 peptides |
78 spectra |
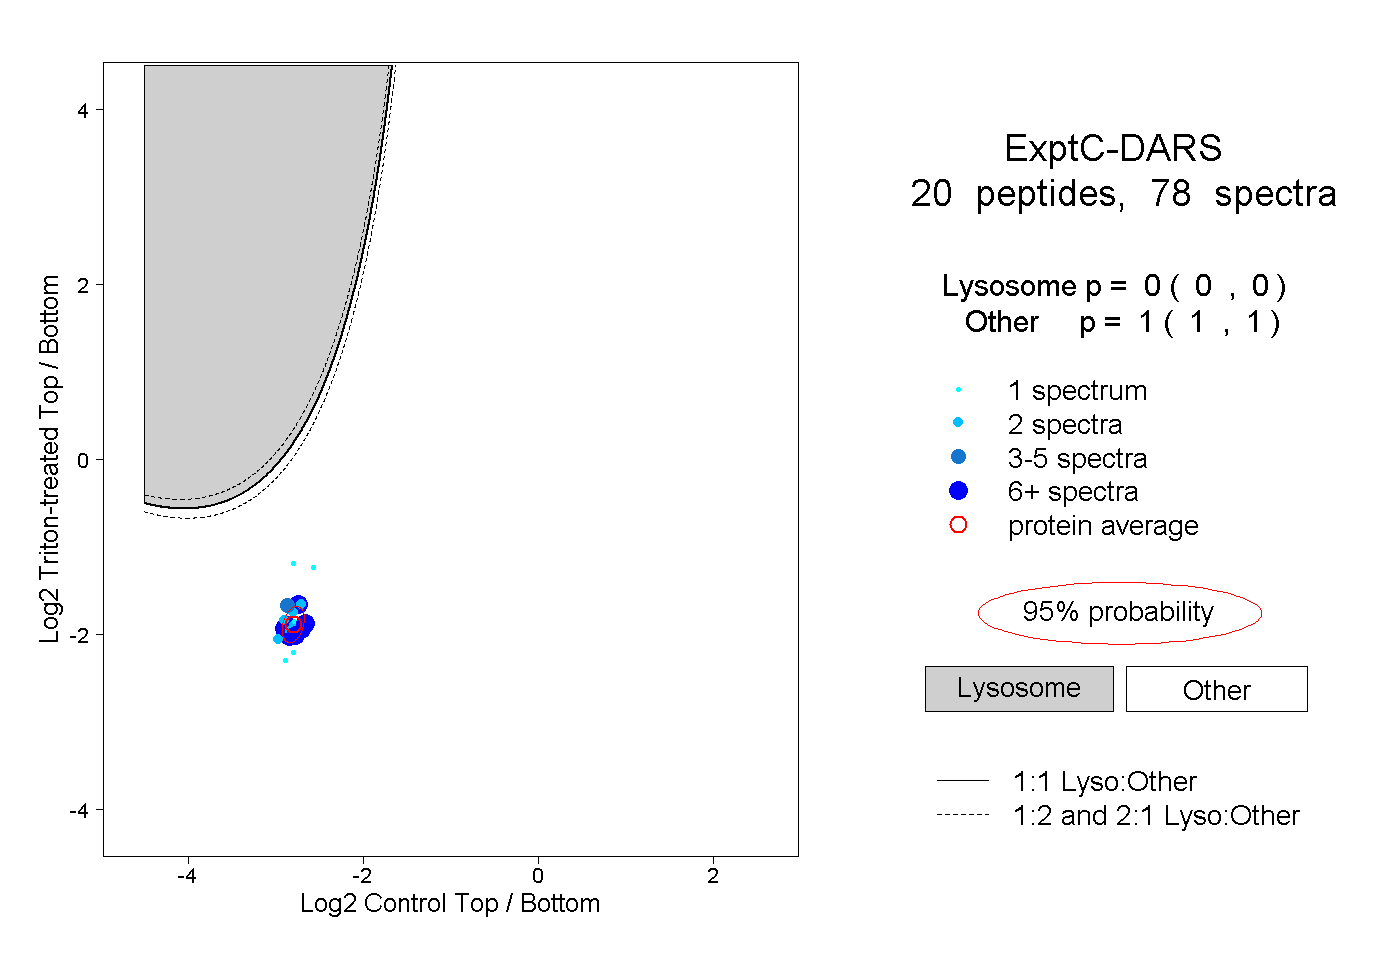 |
0.000 0.000 | 0.000 |
1.000 1.000 | 1.000 |
||||||||
| Plot | Lyso | Other | |||||||||||
| Expt D |
5 peptides |
11 spectra |
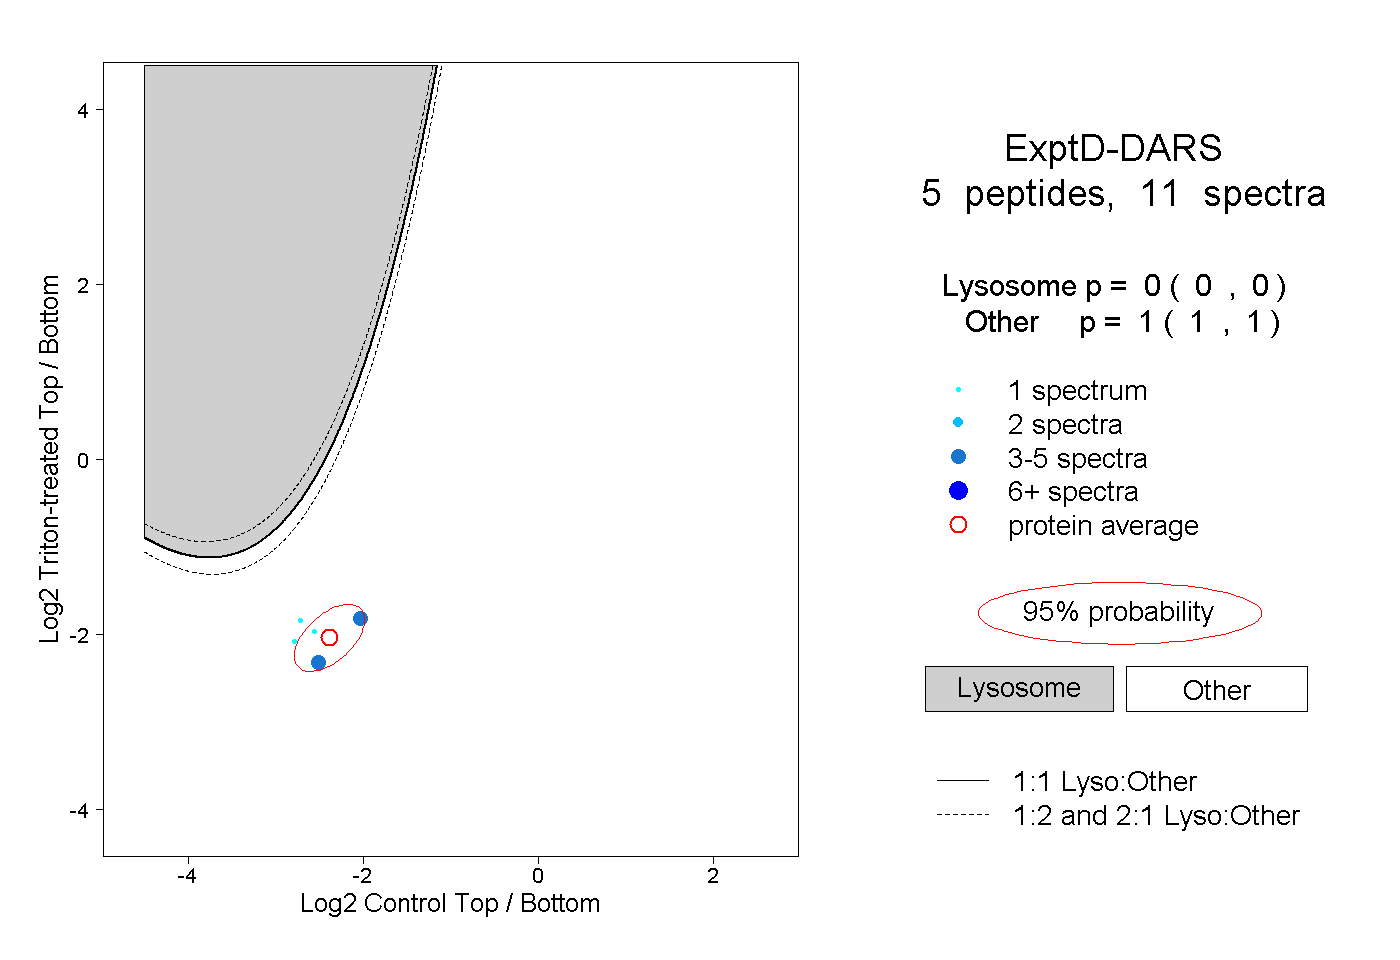 |
0.000 0.000 | 0.000 |
1.000 1.000 | 1.000 |