 2
2peptides
spectra
0.000 | 0.000
0.000 | 0.000
0.000 | 0.000
0.000 | 0.194
0.618 | 0.854
0.000 | 0.000
0.000 | 0.154
0.033 | 0.128
3peptides
spectra
0.000 | 0.000
1.000 | 1.000
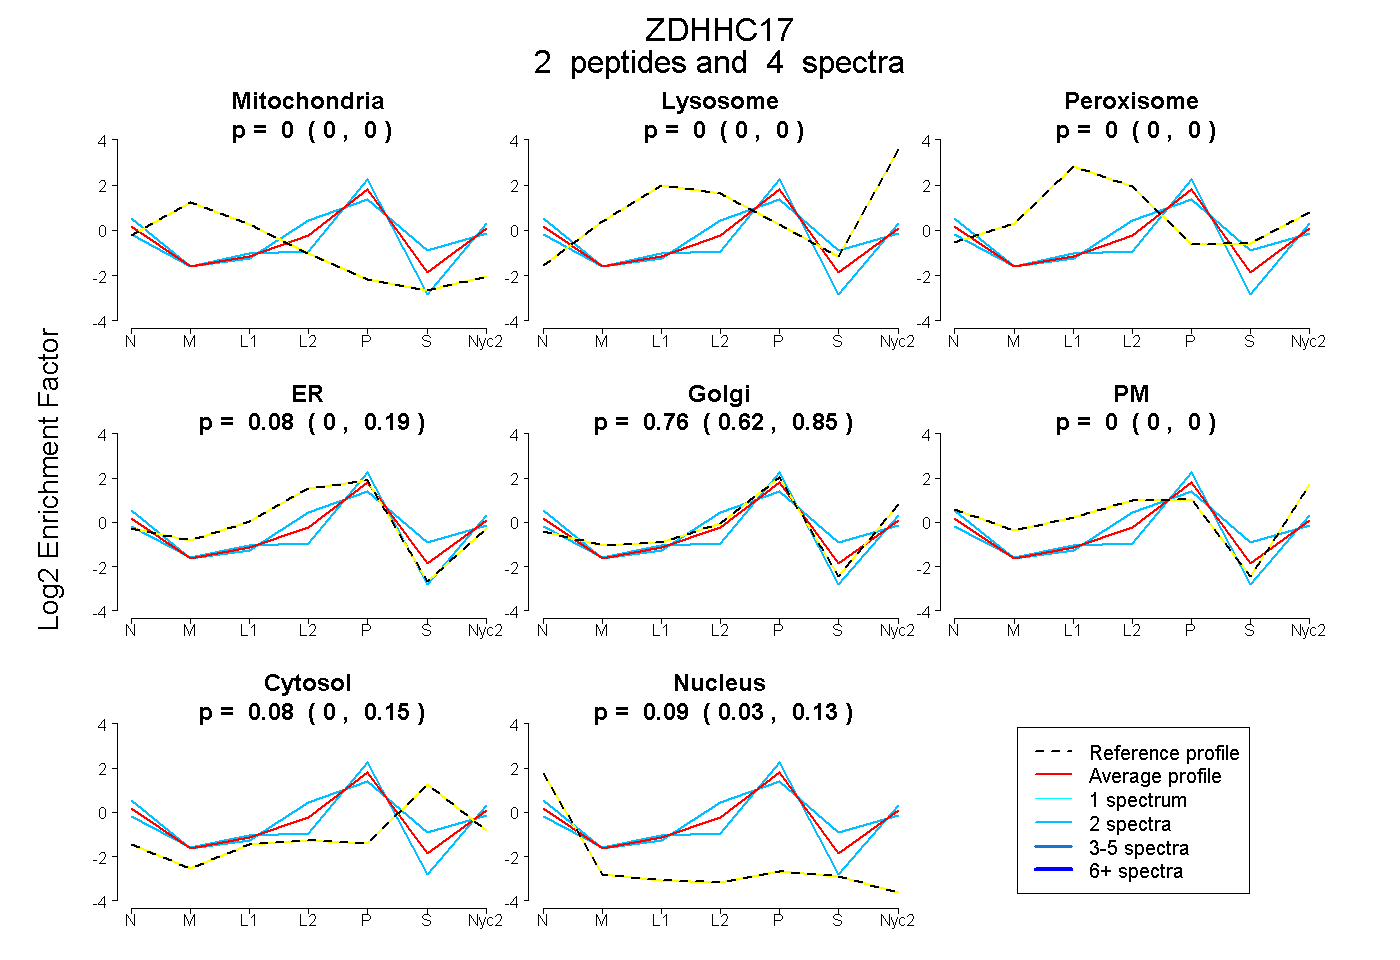
| Plot | Mito | Lyso | Perox | ER | Golgi | PM | Cytosol | Nucleus | |||||
| Expt A |
2 peptides |
4 spectra |
|
0.000 0.000 | 0.000 |
0.000 0.000 | 0.000 |
0.000 0.000 | 0.000 |
0.075 0.000 | 0.194 |
0.763 0.618 | 0.854 |
0.000 0.000 | 0.000 |
0.076 0.000 | 0.154 |
0.086 0.033 | 0.128 |
||
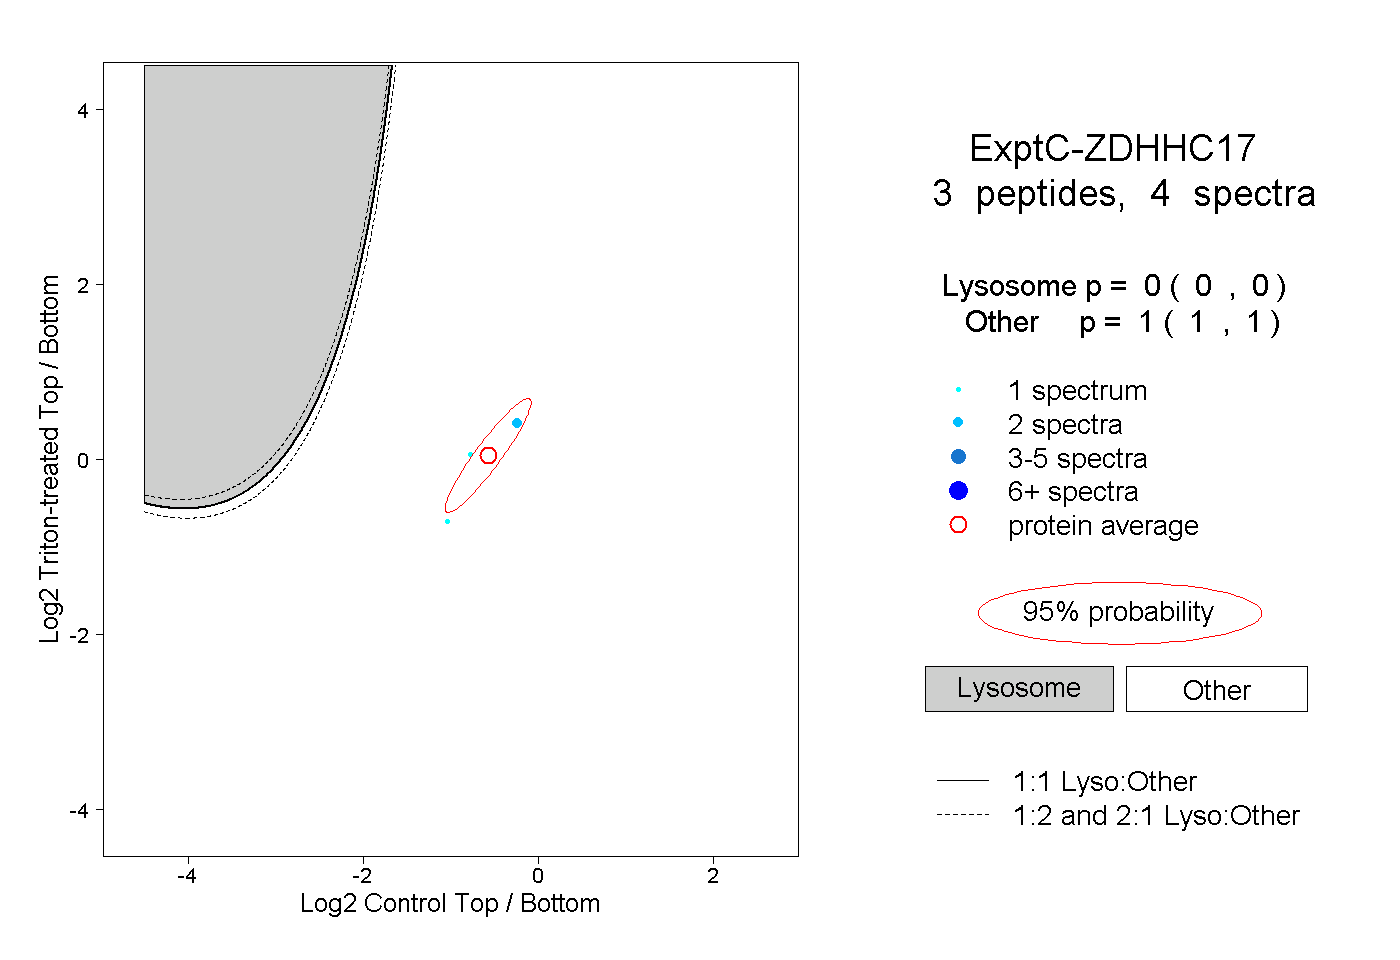
| Plot | Lyso | Other | |||||||||||
| Expt C |
3 peptides |
4 spectra |
|
0.000 0.000 | 0.000 |
1.000 1.000 | 1.000 |