 9
9peptides
spectra
0.000 | 0.000
0.000 | 0.000
0.000 | 0.000
0.689 | 0.737
0.111 | 0.172
0.000 | 0.000
0.072 | 0.124
0.025 | 0.053
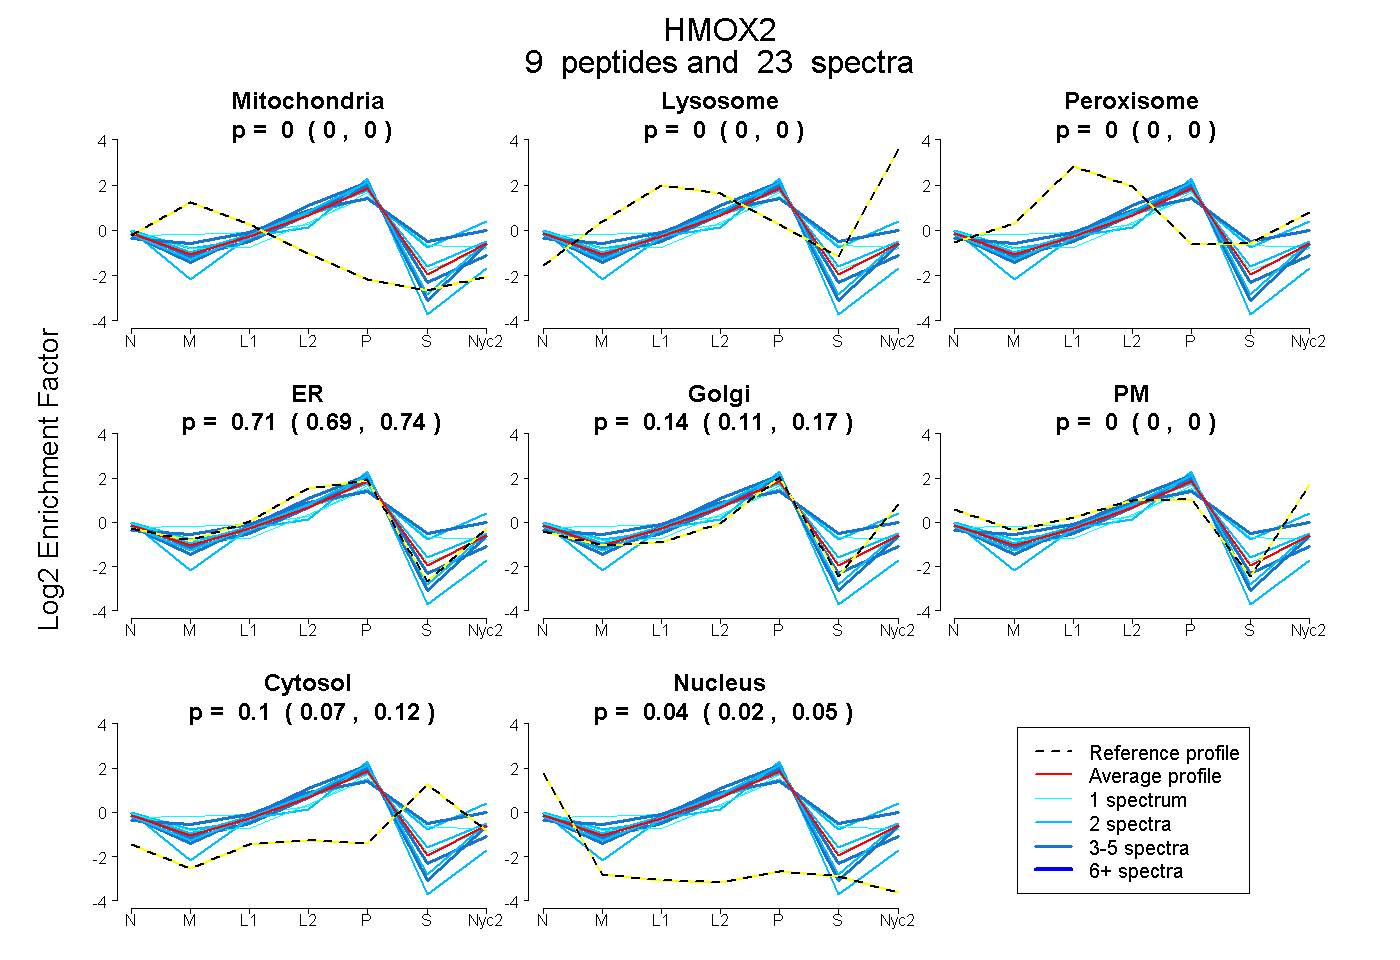
| Plot | Mito | Lyso | Perox | ER | Golgi | PM | Cytosol | Nucleus | |||||
| Expt A |
9 peptides |
23 spectra |
|
0.000 0.000 | 0.000 |
0.000 0.000 | 0.000 |
0.000 0.000 | 0.000 |
0.715 0.689 | 0.737 |
0.144 0.111 | 0.172 |
0.000 0.000 | 0.000 |
0.102 0.072 | 0.124 |
0.040 0.025 | 0.053 |
| 2 spectra, AENTQFVK | 0.000 | 0.000 | 0.000 | 0.723 | 0.118 | 0.000 | 0.149 | 0.009 | ||
| 4 spectra, MNALDLSMK | 0.000 | 0.000 | 0.203 | 0.386 | 0.203 | 0.000 | 0.208 | 0.000 | ||
| 2 spectra, IHYVGQNEPELLVAHAYTR | 0.000 | 0.000 | 0.116 | 0.262 | 0.259 | 0.168 | 0.196 | 0.000 | ||
| 2 spectra, GTLGGSNCPFR | 0.000 | 0.000 | 0.000 | 0.801 | 0.000 | 0.000 | 0.000 | 0.199 | ||
| 2 spectra, YMGDLSGGQVLK | 0.000 | 0.000 | 0.000 | 0.747 | 0.199 | 0.000 | 0.000 | 0.054 | ||
| 1 spectrum, IVEEANK | 0.000 | 0.000 | 0.000 | 0.576 | 0.105 | 0.000 | 0.319 | 0.000 | ||
| 5 spectra, MADLSELLK | 0.000 | 0.000 | 0.000 | 0.882 | 0.057 | 0.000 | 0.000 | 0.061 | ||
| 1 spectrum, AFEYNMQIFSELDQAGSMLTK | 0.162 | 0.000 | 0.000 | 0.538 | 0.232 | 0.000 | 0.068 | 0.000 | ||
| 4 spectra, ETLEDGLPVHDGK | 0.000 | 0.000 | 0.000 | 0.805 | 0.065 | 0.000 | 0.017 | 0.114 |
| Plot | Mito | Lyso or Perox | ER | Golgi | PM | Cytosol | Nucleus | ||||||
| Expt B |
3 peptides |
7 spectra |
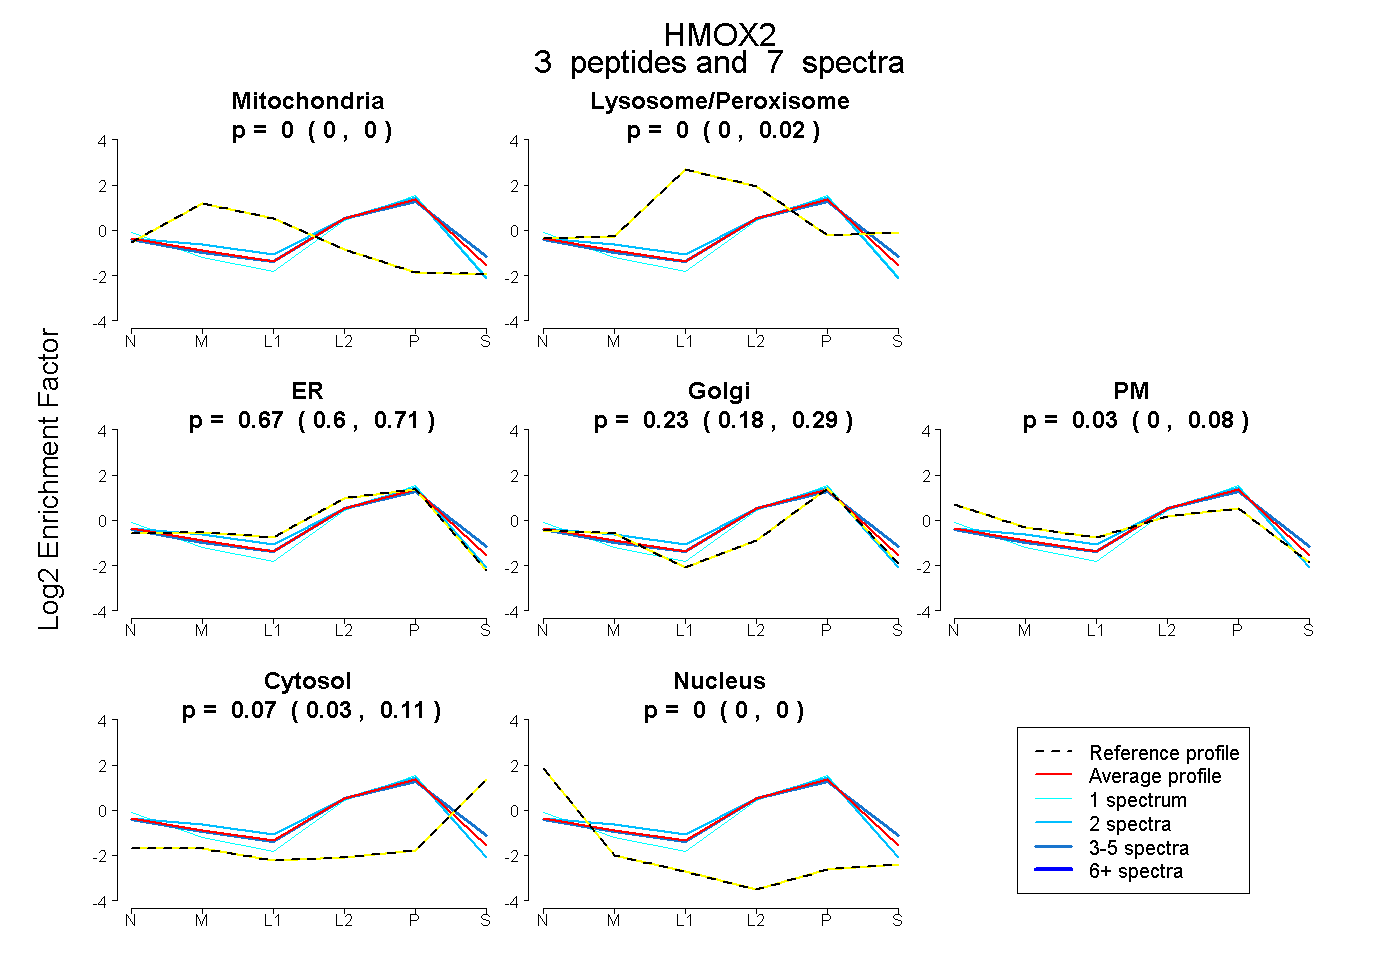 |
0.000 0.000 | 0.000 |
0.000 0.000 | 0.016 |
0.668 0.601 | 0.707 |
0.231 0.176 | 0.285 |
0.025 0.000 | 0.075 |
0.075 0.032 | 0.107 |
0.000 0.000 | 0.000 |
|||
| Plot | Lyso | Other | |||||||||||
| Expt C |
6 peptides |
30 spectra |
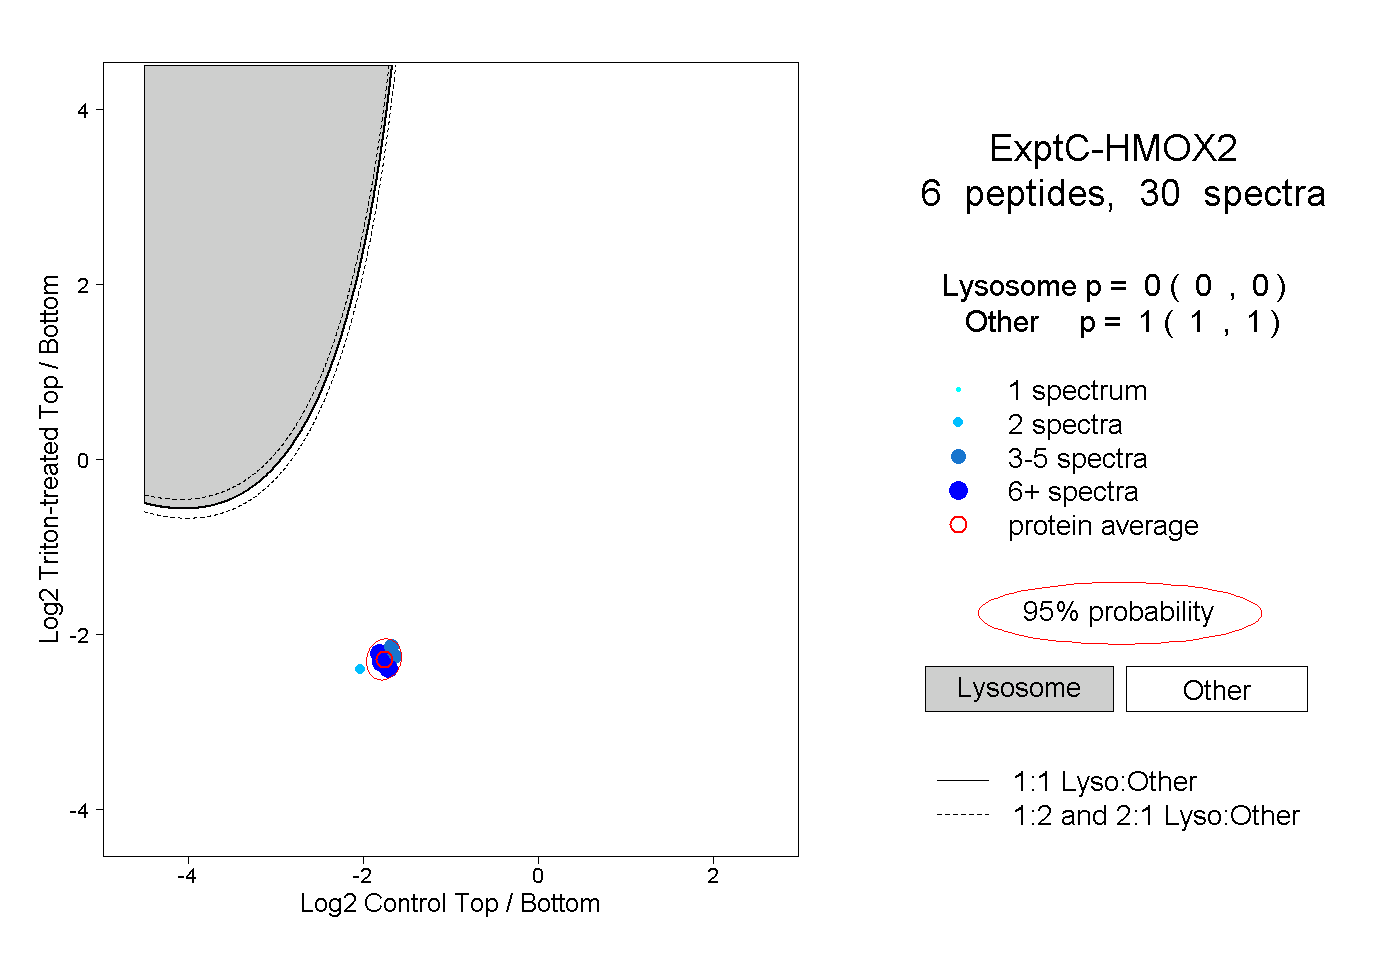 |
0.000 0.000 | 0.000 |
1.000 1.000 | 1.000 |
||||||||
| Plot | Lyso | Other | |||||||||||
| Expt D |
4 peptides |
6 spectra |
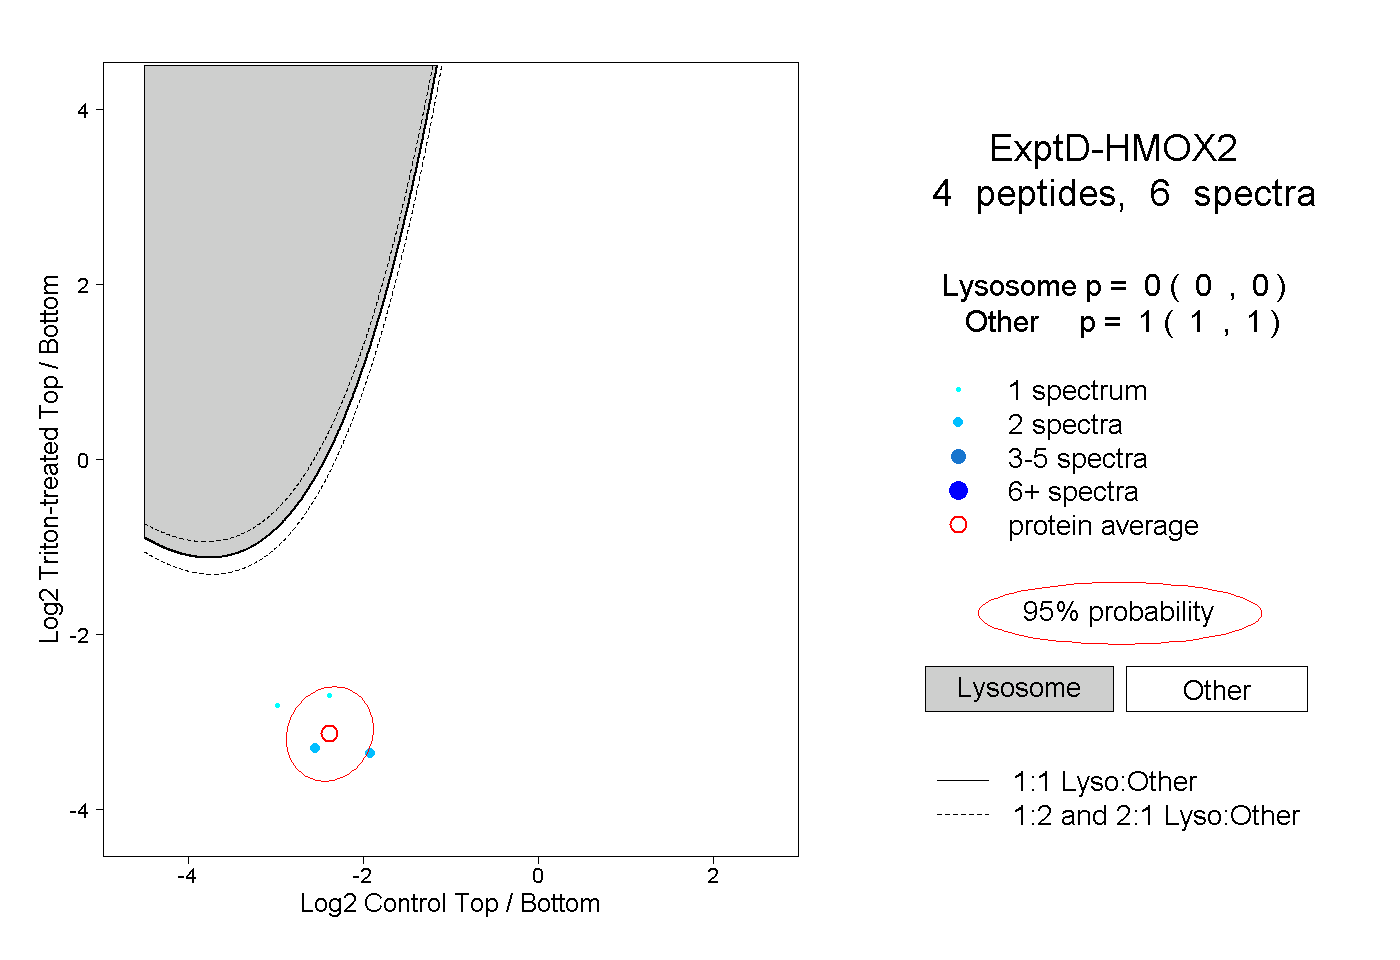 |
0.000 0.000 | 0.000 |
1.000 1.000 | 1.000 |