 5
5peptides
spectra
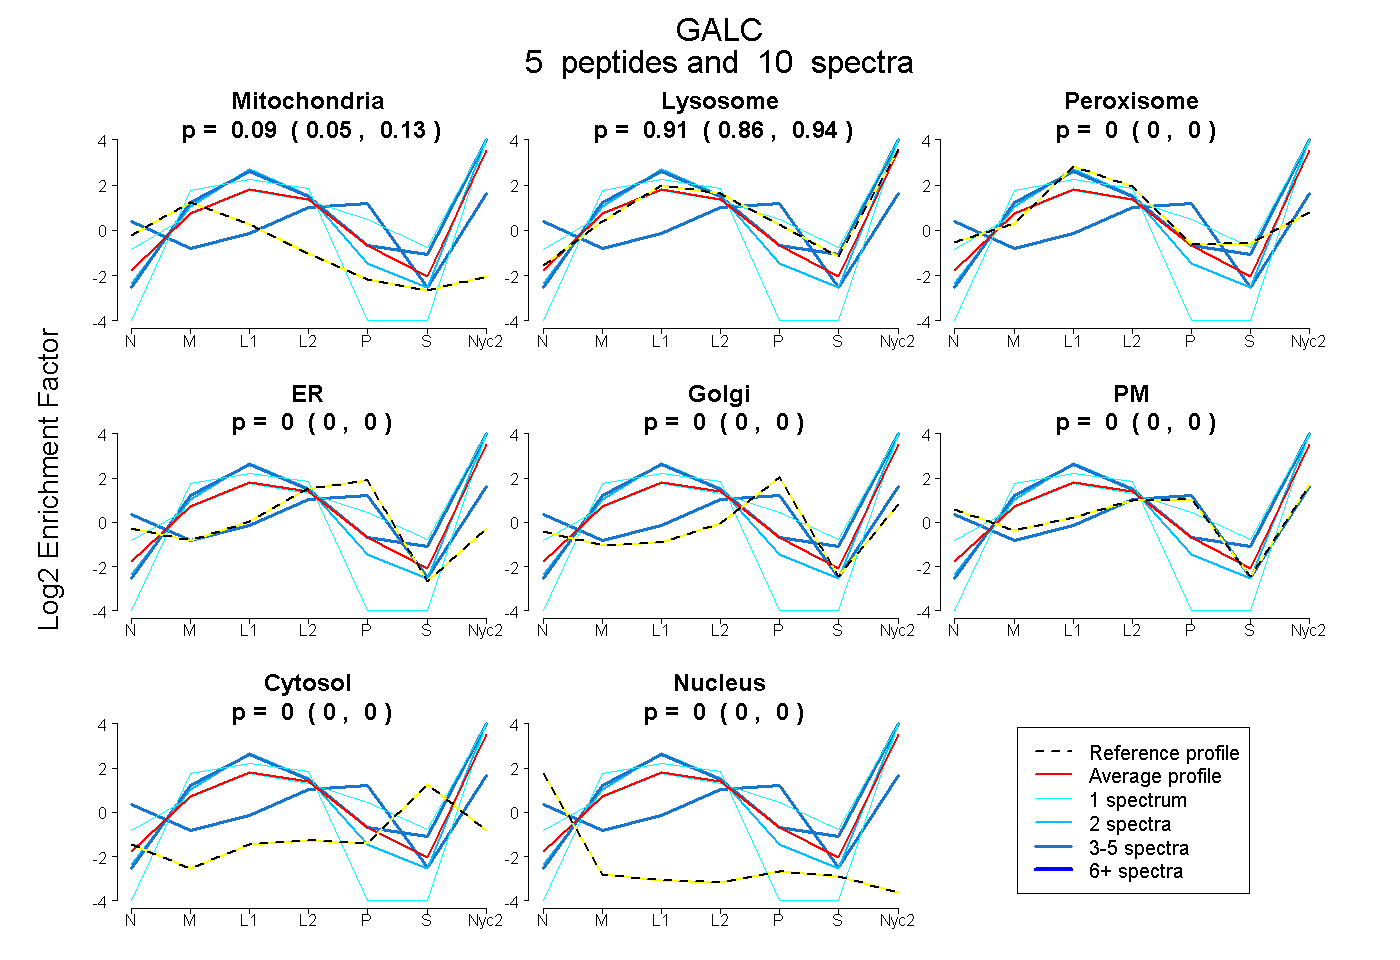
0.048 | 0.128
0.861 | 0.942
0.000 | 0.000
0.000 | 0.000
0.000 | 0.000
0.000 | 0.000
0.000 | 0.000
0.000 | 0.000
2peptides
spectra
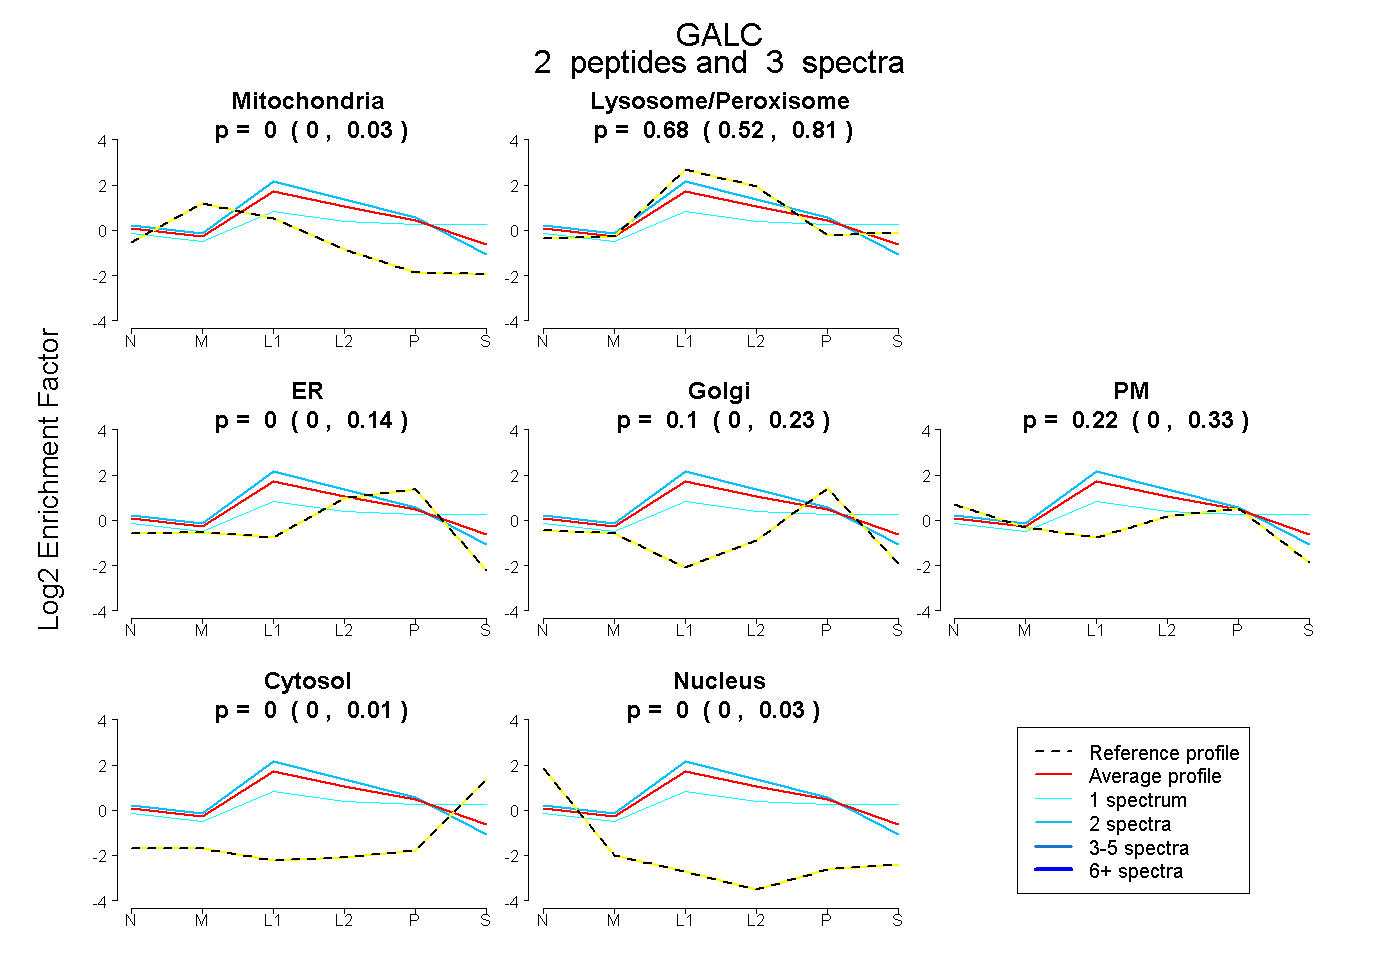
0.000 | 0.029
0.521 | 0.805
0.000 | 0.140
0.000 | 0.227
0.000 | 0.333
0.000 | 0.012
0.000 | 0.030
10peptides
spectra
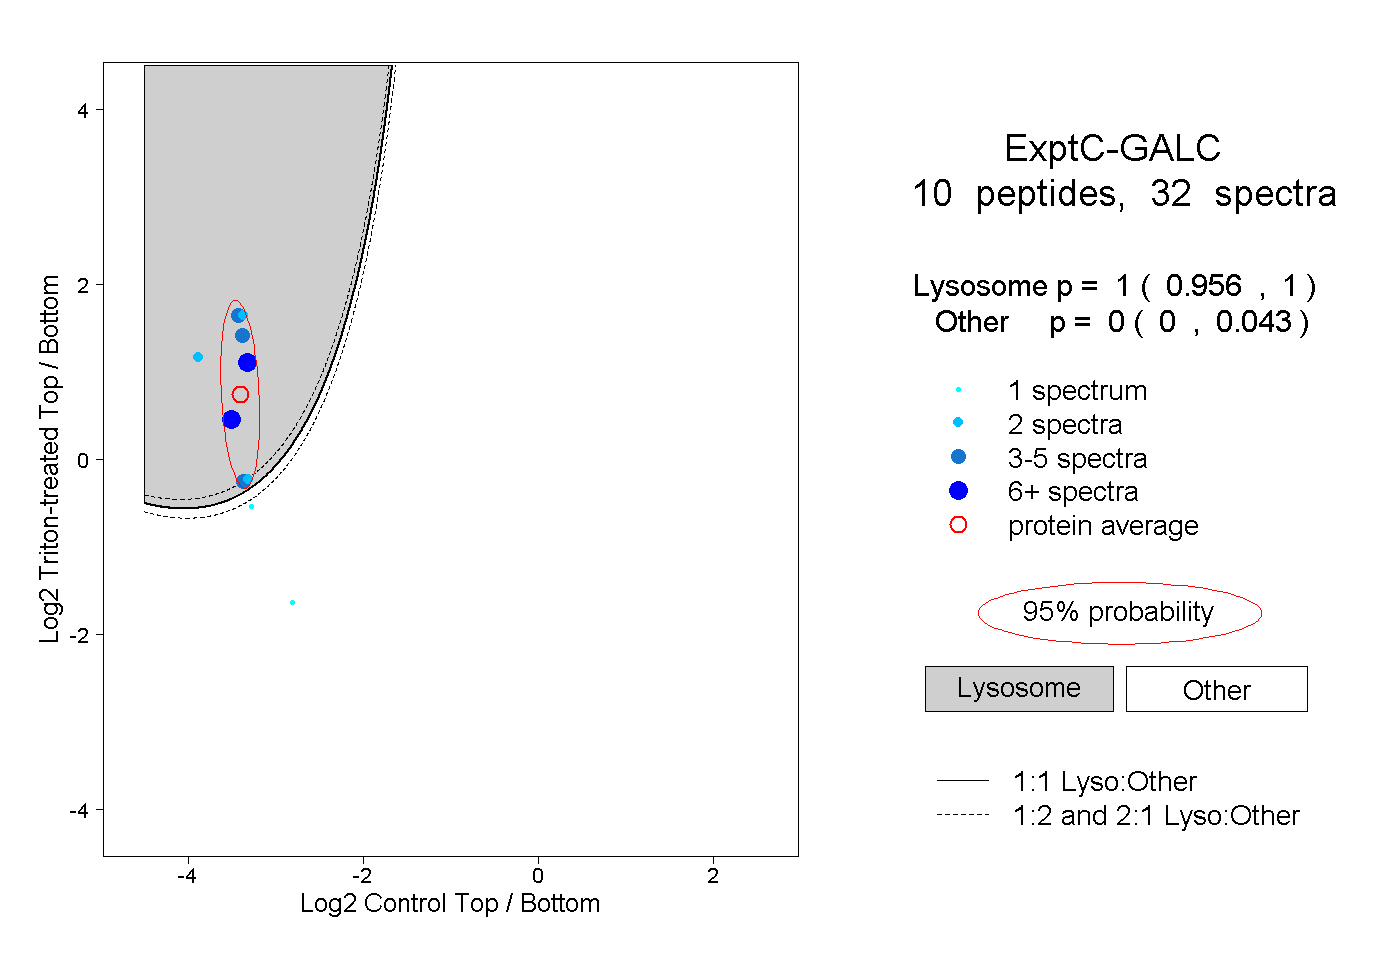
0.956 | 1.000
0.000 | 0.043
1peptide
spectra
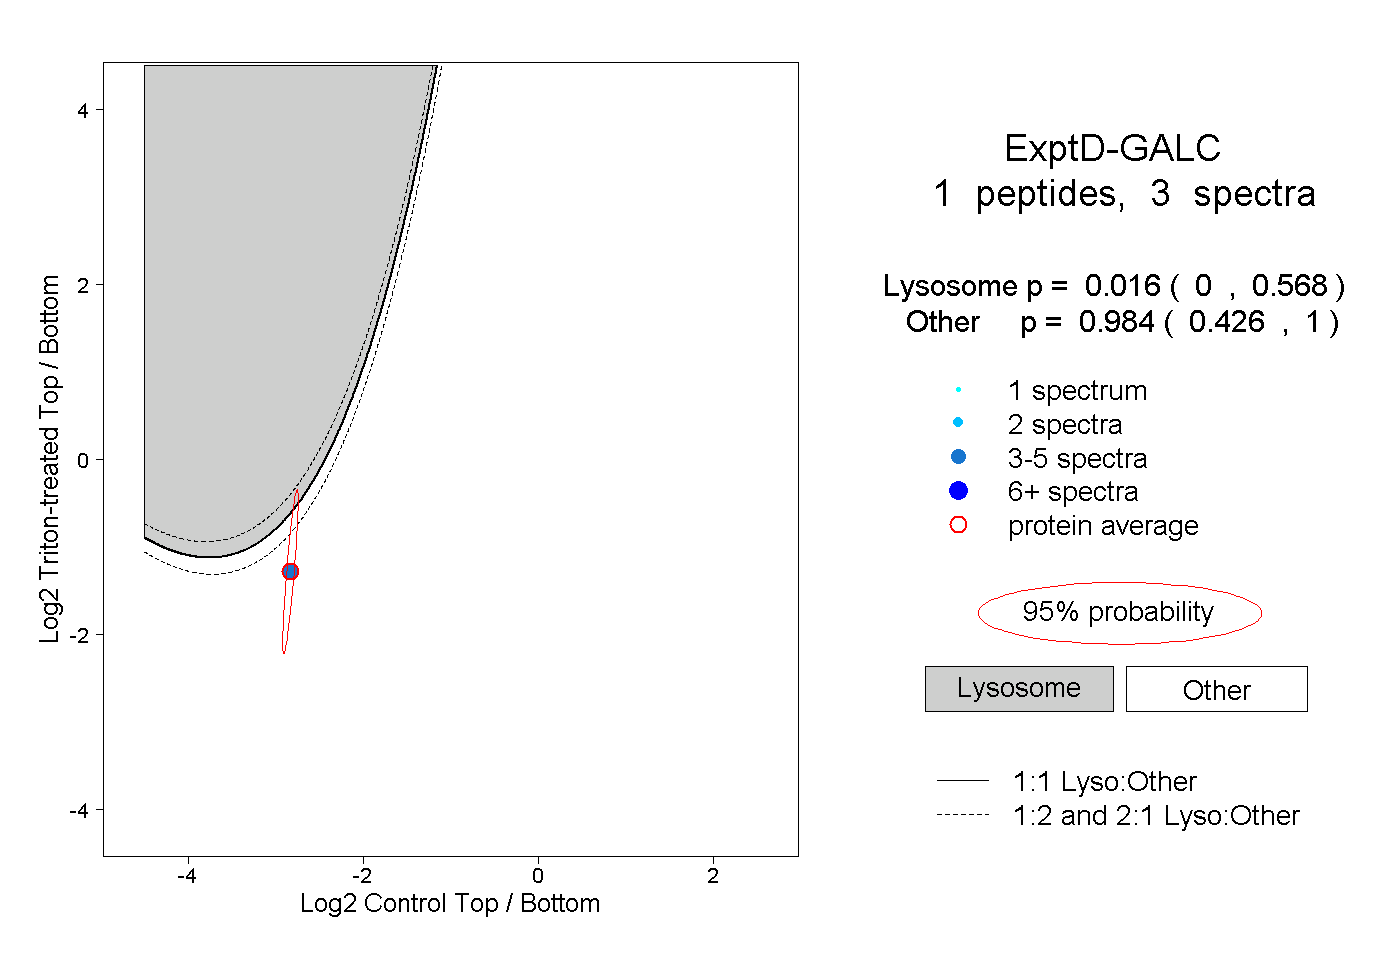
0.000 | 0.568
0.426 | 1.000