 2
2peptides
spectra
0.000 | 0.000
0.282 | 0.426
0.146 | 0.288
0.000 | 0.000
0.320 | 0.444
0.000 | 0.000
0.000 | 0.070
0.000 | 0.000
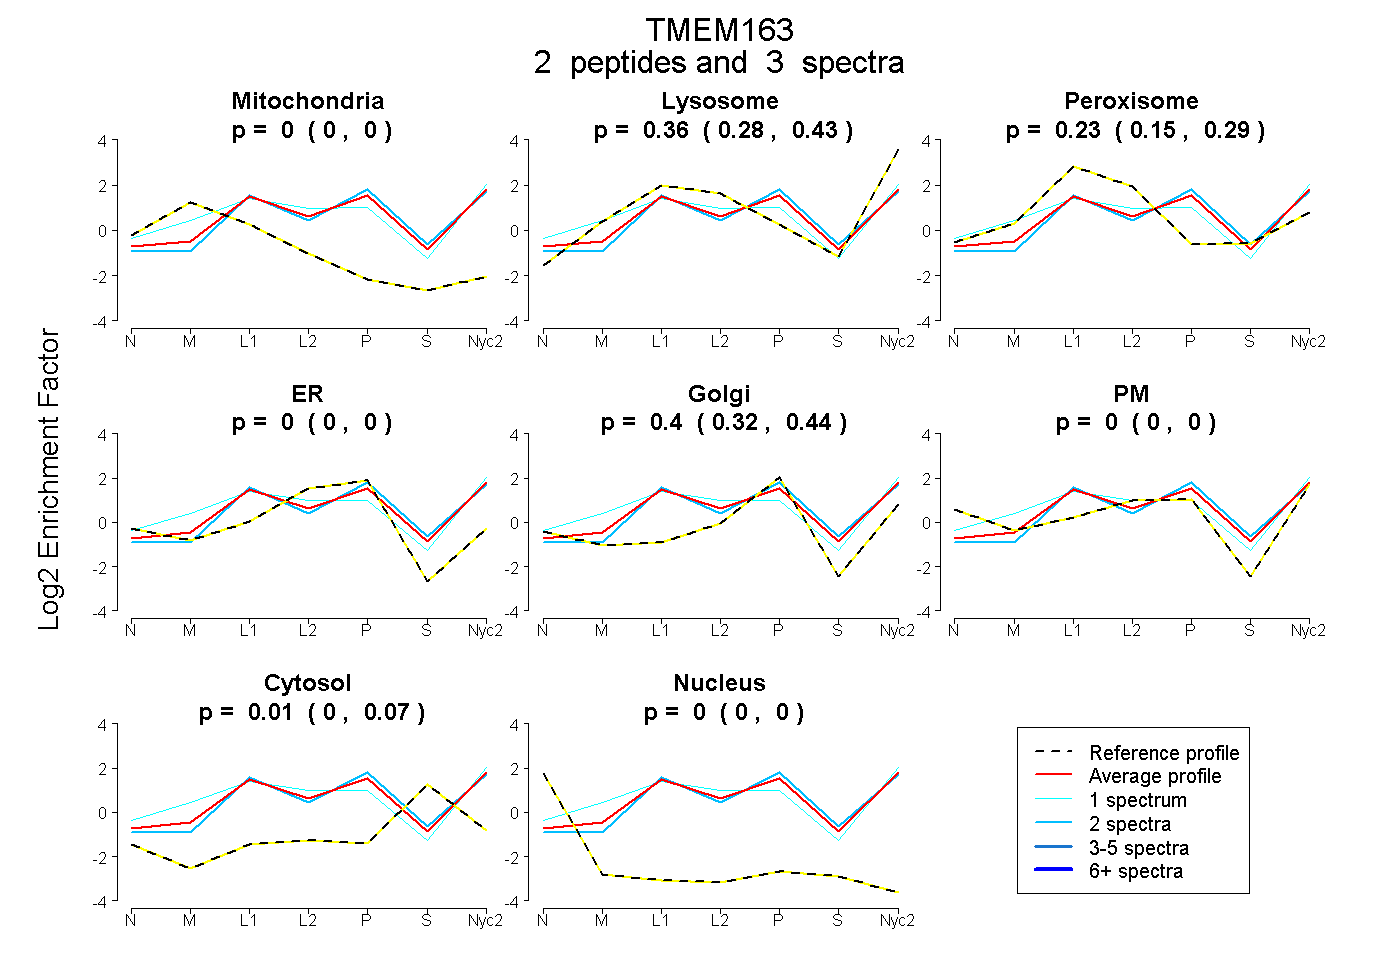
| Plot | Mito | Lyso | Perox | ER | Golgi | PM | Cytosol | Nucleus | |||||
| Expt A |
2 peptides |
3 spectra |
|
0.000 0.000 | 0.000 |
0.356 0.282 | 0.426 |
0.230 0.146 | 0.288 |
0.000 0.000 | 0.000 |
0.400 0.320 | 0.444 |
0.000 0.000 | 0.000 |
0.014 0.000 | 0.070 |
0.000 0.000 | 0.000 |
| 1 spectrum, GLLESSTR | 0.000 | 0.362 | 0.224 | 0.000 | 0.171 | 0.243 | 0.000 | 0.000 | ||
| 2 spectra, SPPGPGVPRPPPR | 0.000 | 0.357 | 0.179 | 0.000 | 0.404 | 0.000 | 0.060 | 0.000 |