23
23peptides
spectra
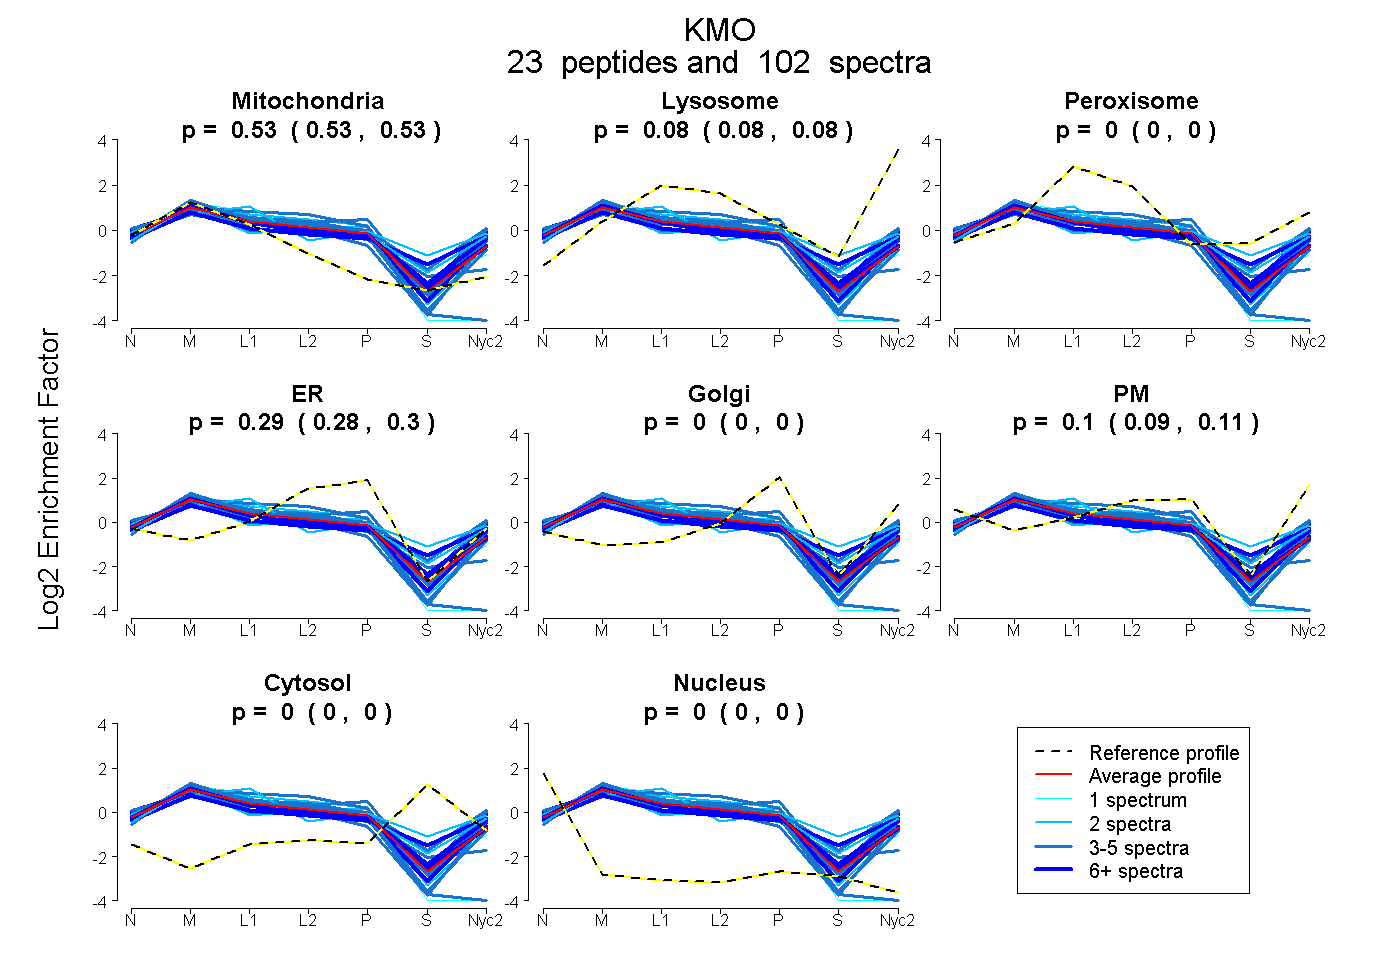
0.525 | 0.531
0.078 | 0.085
0.000 | 0.000
0.282 | 0.299
0.000 | 0.000
0.088 | 0.108
0.000 | 0.000
0.000 | 0.000
14peptides
spectra
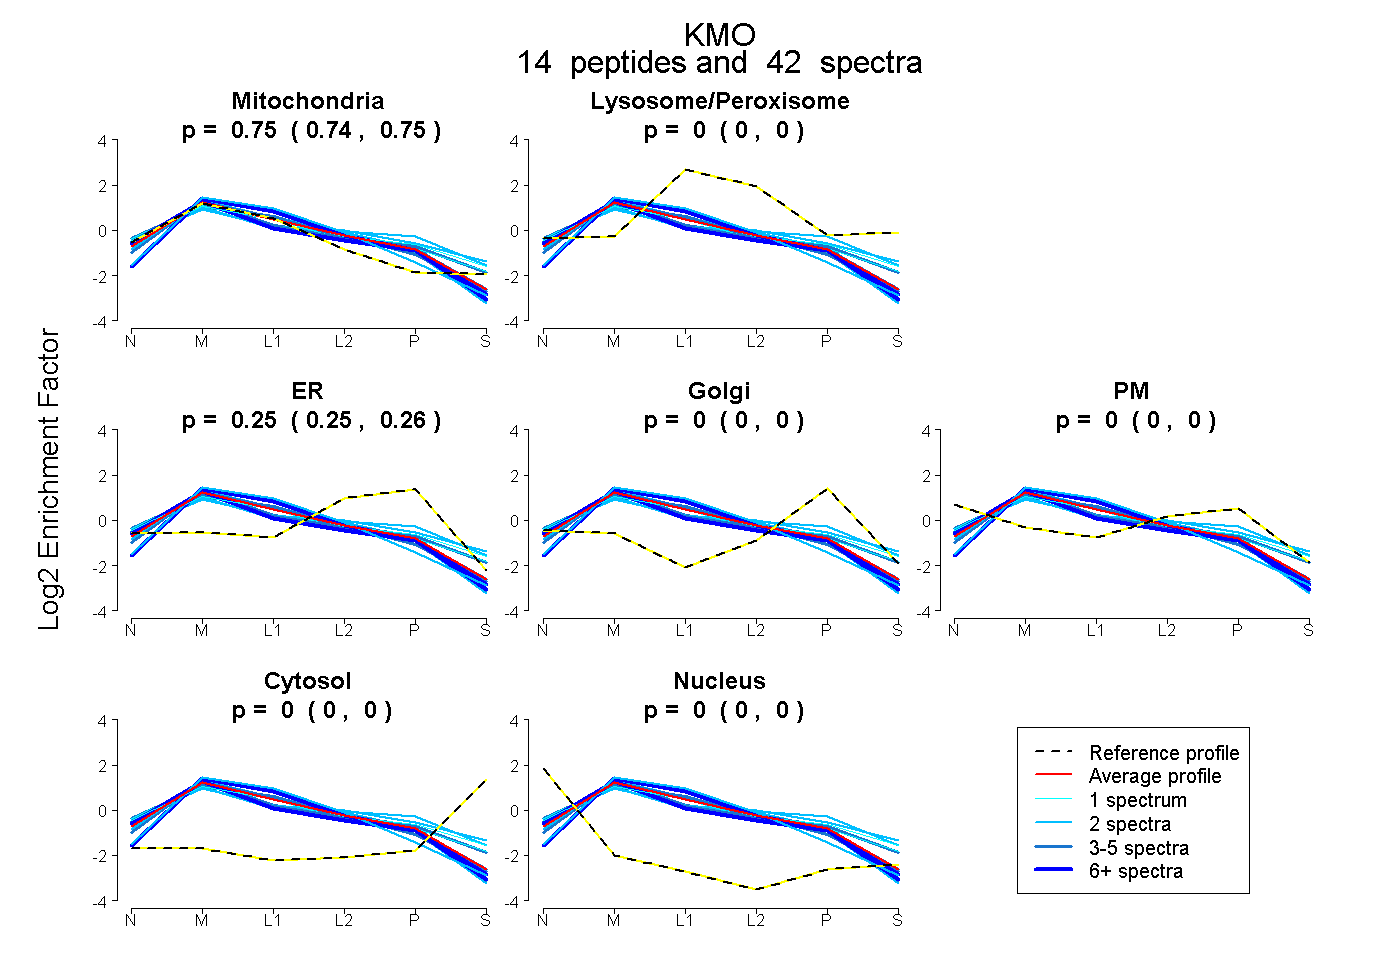
0.744 | 0.752
0.000 | 0.000
0.248 | 0.256
0.000 | 0.000
0.000 | 0.000
0.000 | 0.000
0.000 | 0.000