 23
23peptides
spectra
0.525 | 0.531
0.078 | 0.085
0.000 | 0.000
0.282 | 0.299
0.000 | 0.000
0.088 | 0.108
0.000 | 0.000
0.000 | 0.000
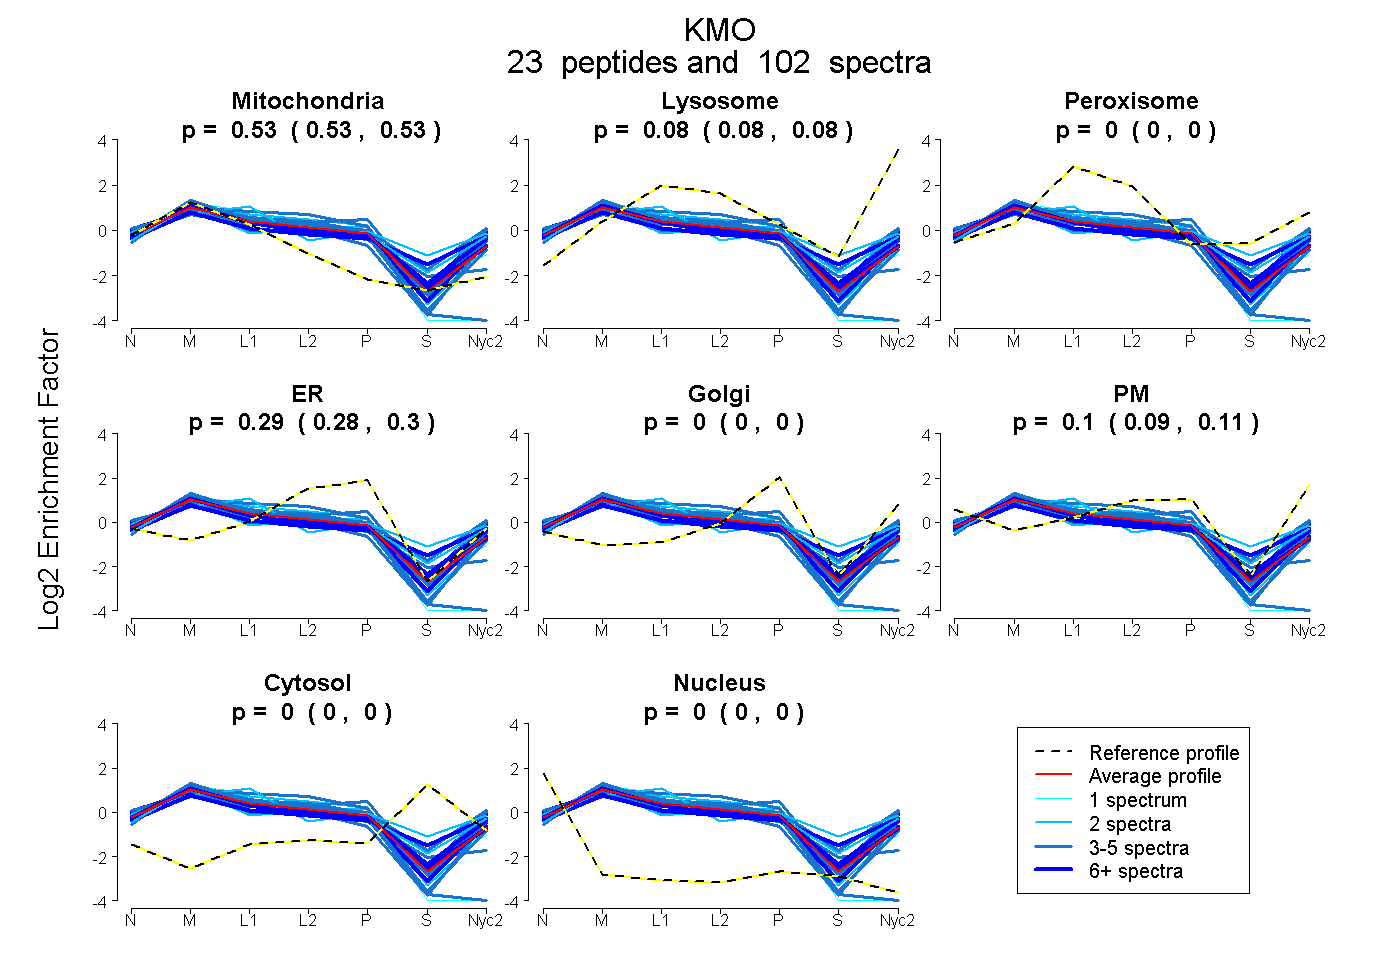
| Plot | Mito | Lyso | Perox | ER | Golgi | PM | Cytosol | Nucleus | |||||
| Expt A |
23 peptides |
102 spectra |
|
0.528 0.525 | 0.531 |
0.082 0.078 | 0.085 |
0.000 0.000 | 0.000 |
0.291 0.282 | 0.299 |
0.000 0.000 | 0.000 |
0.098 0.088 | 0.108 |
0.000 0.000 | 0.000 |
0.000 0.000 | 0.000 |
| 2 spectra, VANFMR | 0.487 | 0.202 | 0.038 | 0.149 | 0.123 | 0.000 | 0.000 | 0.000 | ||
| 5 spectra, NGEYAMEPNCLHIWPR | 0.486 | 0.155 | 0.000 | 0.320 | 0.000 | 0.039 | 0.000 | 0.000 | ||
| 6 spectra, AVGLEDQIVSK | 0.491 | 0.049 | 0.000 | 0.170 | 0.000 | 0.290 | 0.000 | 0.000 | ||
| 8 spectra, MIHSLSGK | 0.522 | 0.088 | 0.000 | 0.294 | 0.000 | 0.097 | 0.000 | 0.000 | ||
| 10 spectra, YHEAVLR | 0.553 | 0.075 | 0.000 | 0.219 | 0.042 | 0.111 | 0.000 | 0.000 | ||
| 4 spectra, NFQVDVYEAR | 0.590 | 0.000 | 0.000 | 0.078 | 0.000 | 0.333 | 0.000 | 0.000 | ||
| 1 spectrum, LPTHSDVLDFFQK | 0.556 | 0.000 | 0.000 | 0.136 | 0.000 | 0.308 | 0.000 | 0.000 | ||
| 2 spectra, FNNDLSVCLPEFSR | 0.501 | 0.000 | 0.000 | 0.352 | 0.109 | 0.038 | 0.000 | 0.000 | ||
| 12 spectra, SQYILSISR | 0.511 | 0.127 | 0.000 | 0.175 | 0.010 | 0.177 | 0.000 | 0.000 | ||
| 7 spectra, NFPDAIPLMGEQALMR | 0.506 | 0.076 | 0.000 | 0.213 | 0.000 | 0.204 | 0.000 | 0.000 | ||
| 1 spectrum, DITCDLIVGCDGAYSTVR | 0.748 | 0.000 | 0.000 | 0.252 | 0.000 | 0.000 | 0.000 | 0.000 | ||
| 6 spectra, DFFLLPAQPMISVK | 0.459 | 0.093 | 0.000 | 0.100 | 0.000 | 0.348 | 0.000 | 0.000 | ||
| 3 spectra, SAIPYGNK | 0.354 | 0.071 | 0.167 | 0.000 | 0.246 | 0.160 | 0.003 | 0.000 | ||
| 5 spectra, VHFGHK | 0.544 | 0.011 | 0.000 | 0.317 | 0.000 | 0.128 | 0.000 | 0.000 | ||
| 3 spectra, SFTCTLFMSFEEFEK | 0.774 | 0.000 | 0.000 | 0.226 | 0.000 | 0.000 | 0.000 | 0.000 | ||
| 3 spectra, SADISPR | 0.388 | 0.007 | 0.000 | 0.334 | 0.000 | 0.271 | 0.000 | 0.000 | ||
| 2 spectra, CCPEEGILTMLGPNK | 0.472 | 0.078 | 0.000 | 0.450 | 0.000 | 0.000 | 0.000 | 0.000 | ||
| 8 spectra, SINLALSYR | 0.452 | 0.118 | 0.106 | 0.000 | 0.242 | 0.015 | 0.067 | 0.000 | ||
| 5 spectra, NAFMMIALPNMDK | 0.489 | 0.207 | 0.000 | 0.112 | 0.000 | 0.193 | 0.000 | 0.000 | ||
| 1 spectrum, CSPFHLK | 0.549 | 0.055 | 0.025 | 0.358 | 0.000 | 0.013 | 0.000 | 0.000 | ||
| 3 spectra, DLLTAVESYPNAK | 0.636 | 0.000 | 0.000 | 0.343 | 0.000 | 0.000 | 0.021 | 0.000 | ||
| 3 spectra, IPDDHAISDLSMYNYIEMR | 0.383 | 0.152 | 0.000 | 0.269 | 0.000 | 0.197 | 0.000 | 0.000 | ||
| 2 spectra, SAWTGTSGHWNR | 0.348 | 0.014 | 0.354 | 0.000 | 0.244 | 0.000 | 0.040 | 0.000 |
| Plot | Mito | Lyso or Perox | ER | Golgi | PM | Cytosol | Nucleus | ||||||
| Expt B |
14 peptides |
42 spectra |
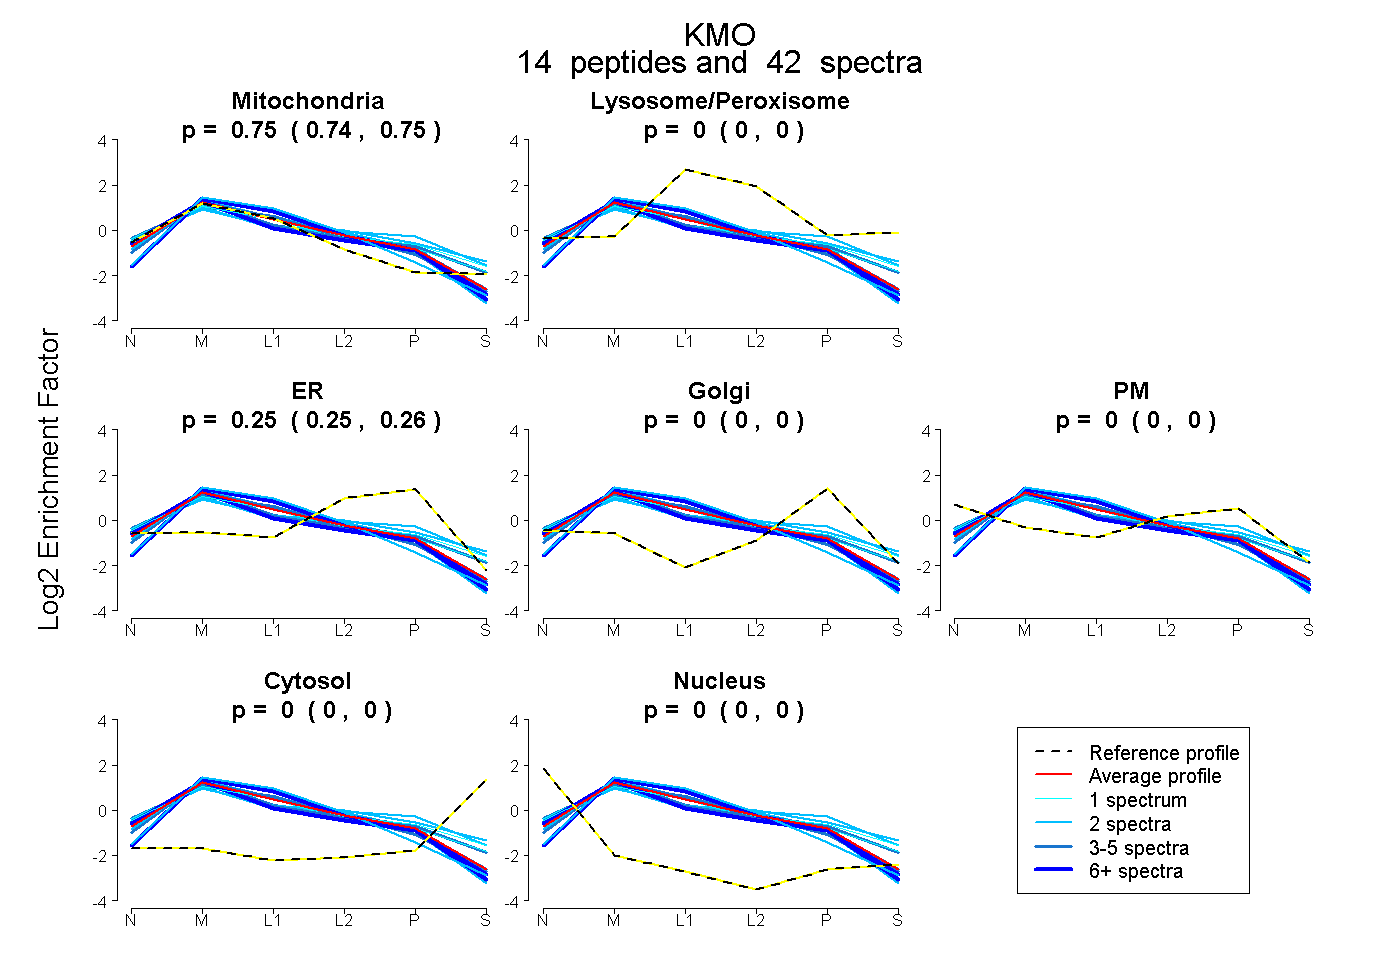 |
0.748 0.744 | 0.752 |
0.000 0.000 | 0.000 |
0.252 0.248 | 0.256 |
0.000 0.000 | 0.000 |
0.000 0.000 | 0.000 |
0.000 0.000 | 0.000 |
0.000 0.000 | 0.000 |
|||
| Plot | Lyso | Other | |||||||||||
| Expt C |
23 peptides |
248 spectra |
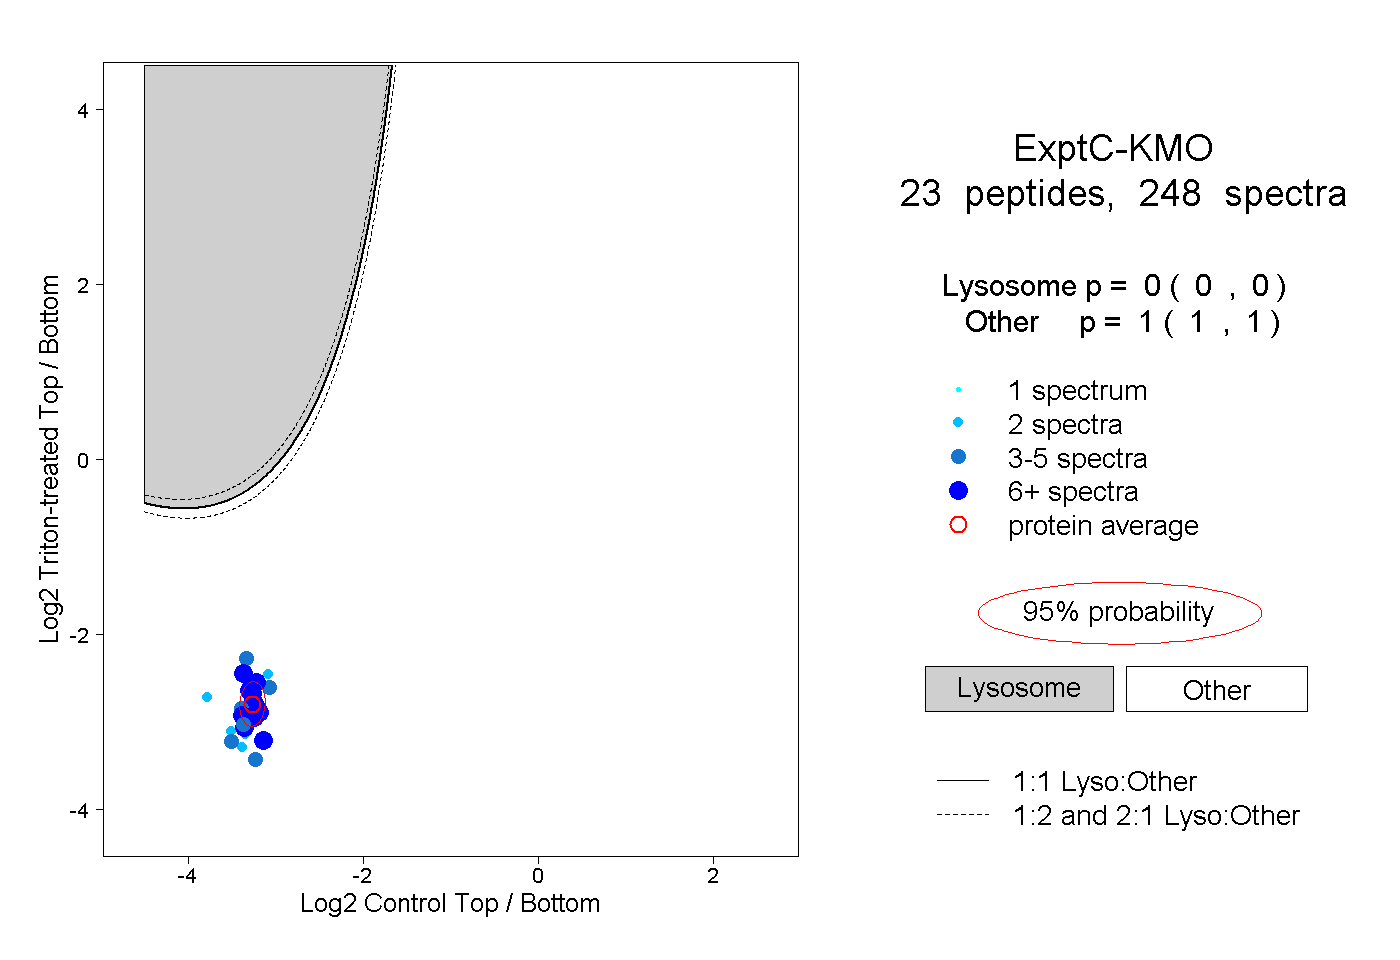 |
0.000 0.000 | 0.000 |
1.000 1.000 | 1.000 |
||||||||
| Plot | Lyso | Other | |||||||||||
| Expt D |
9 peptides |
13 spectra |
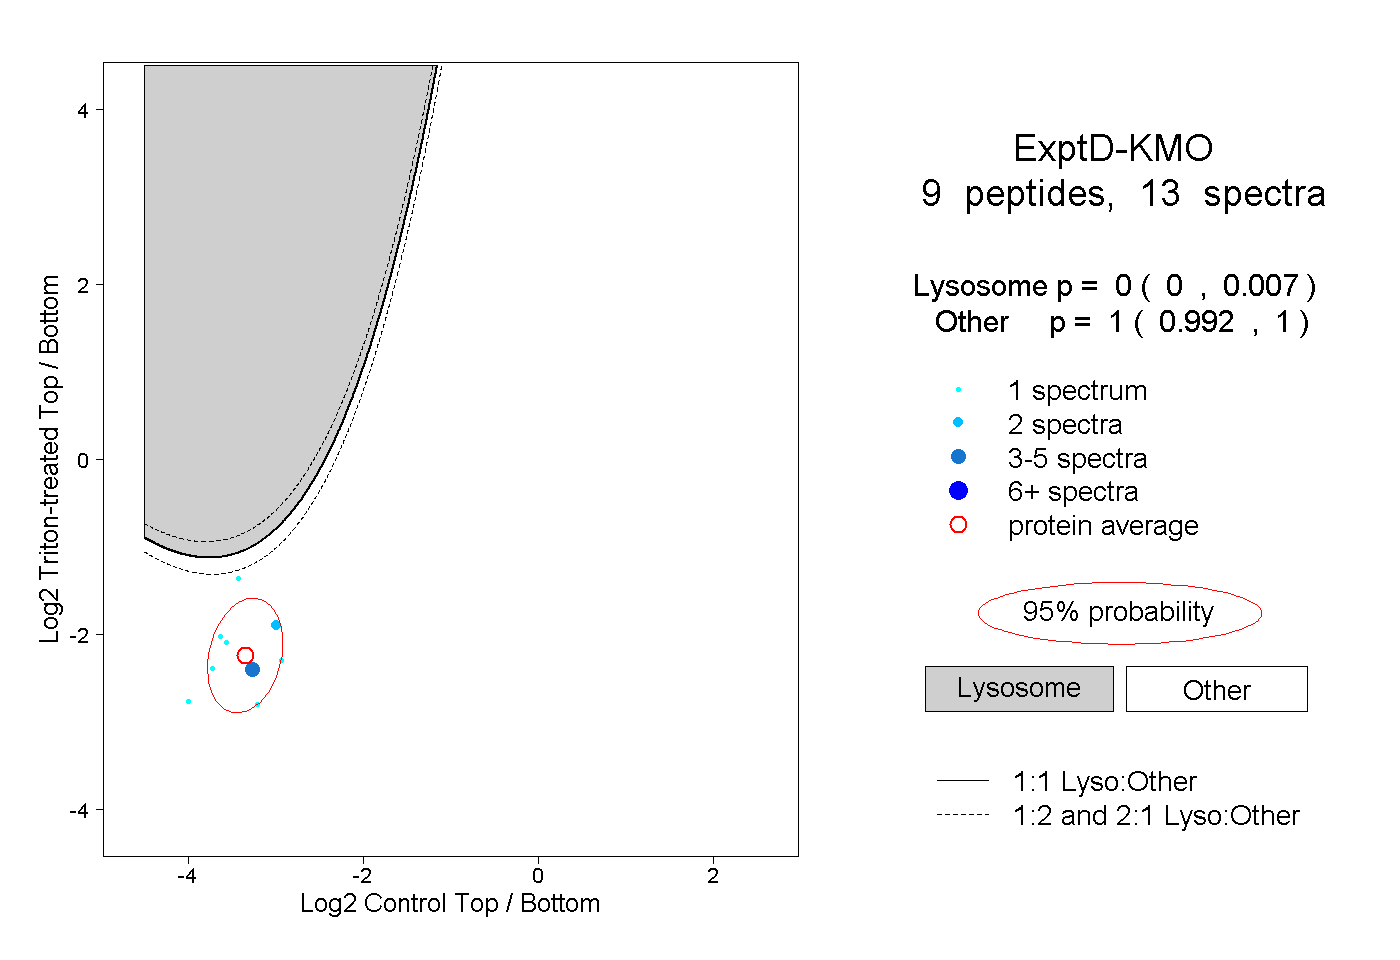 |
0.000 0.000 | 0.007 |
1.000 0.992 | 1.000 |