 5
5peptides
spectra
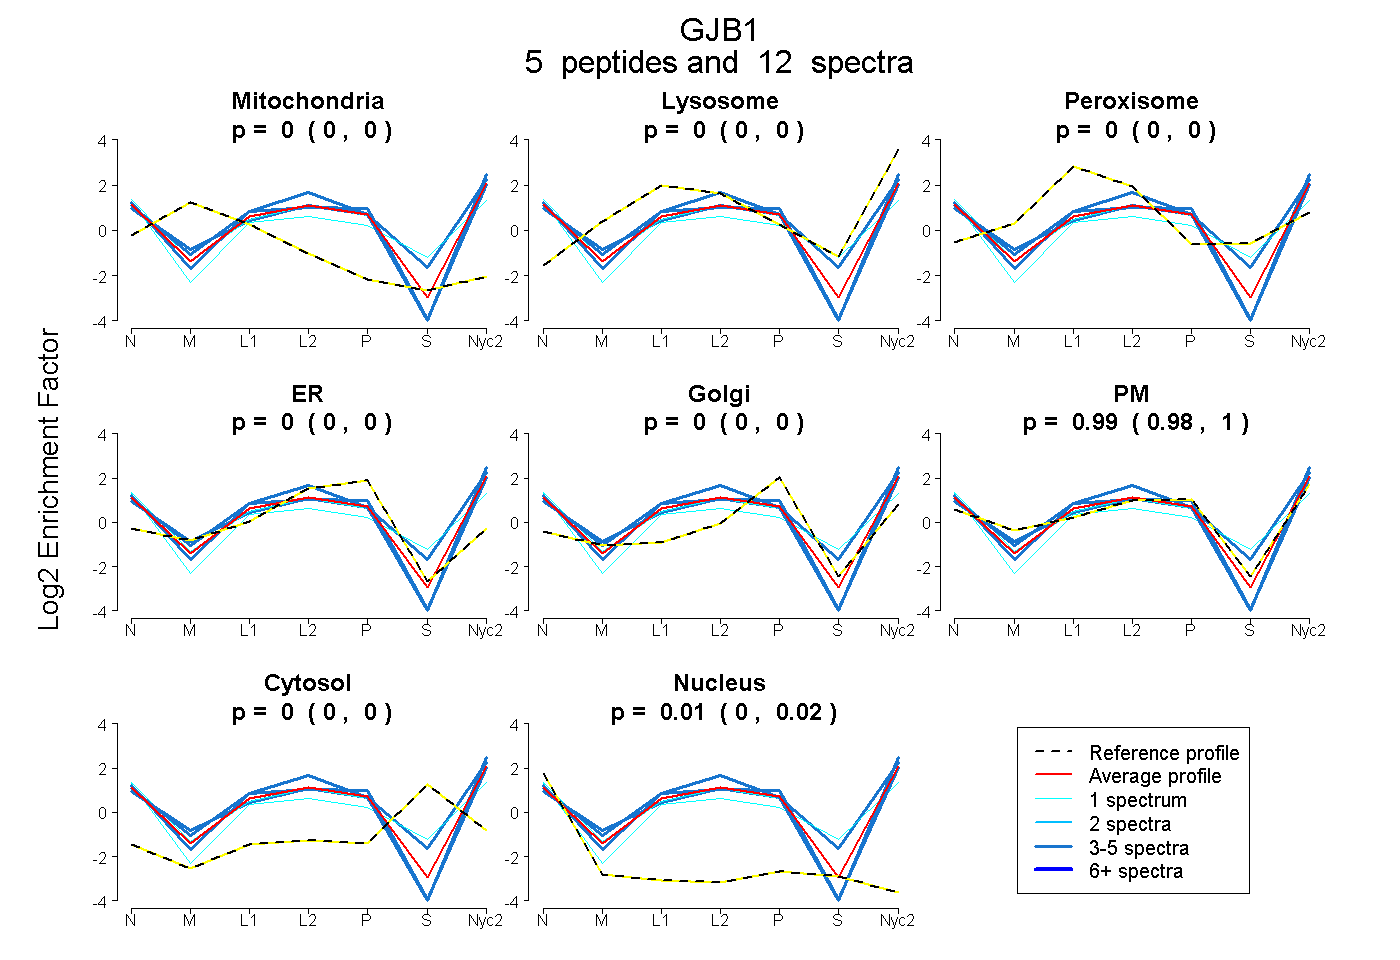
0.000 | 0.000
0.000 | 0.000
0.000 | 0.000
0.000 | 0.000
0.000 | 0.000
0.979 | 0.999
0.000 | 0.000
0.000 | 0.020
3peptides
spectra
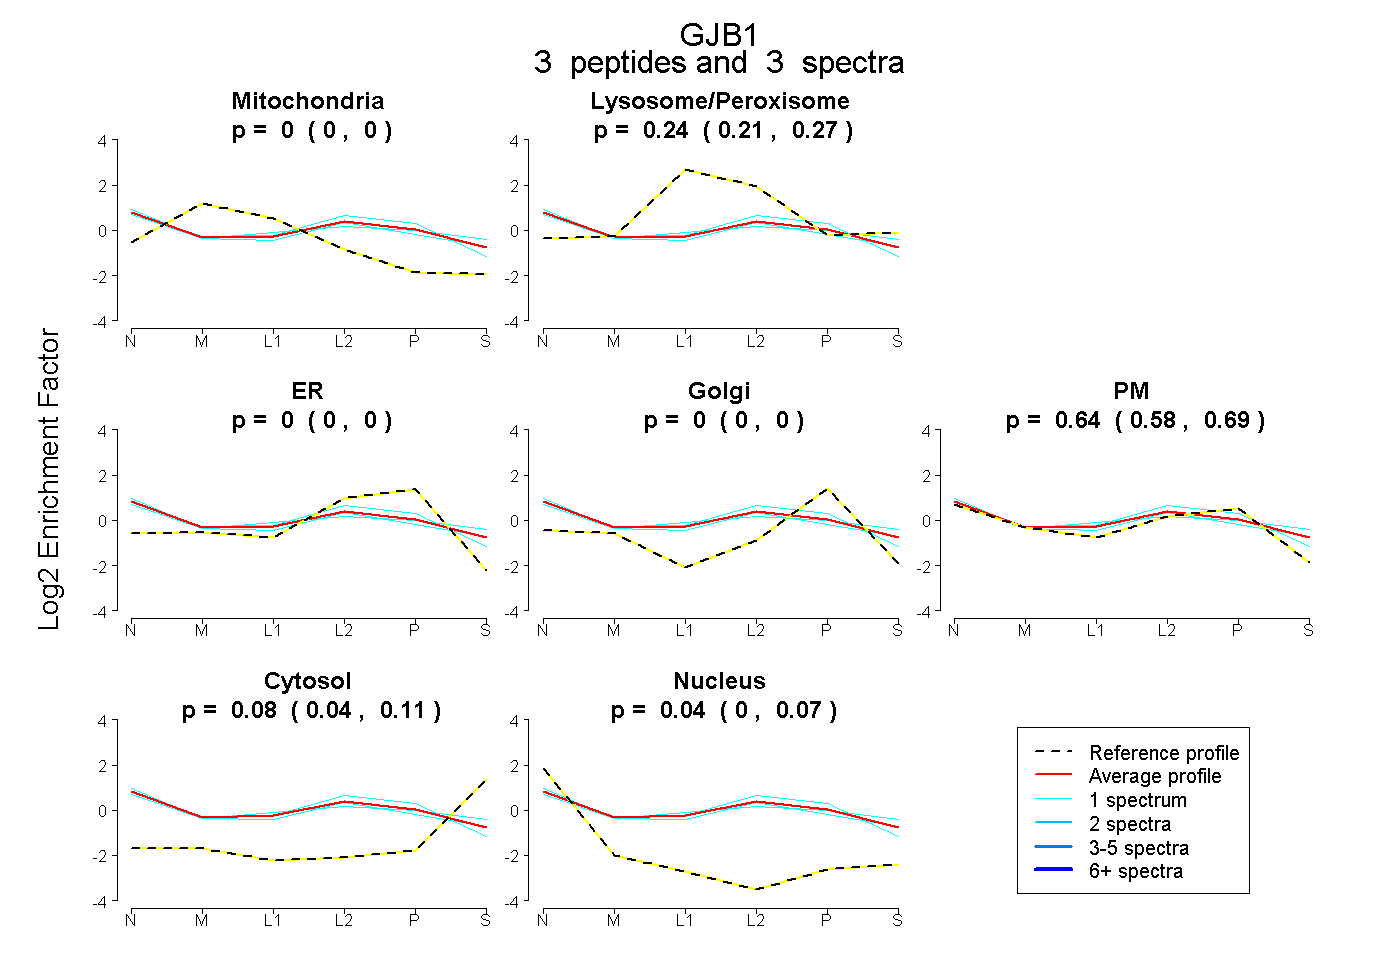
0.000 | 0.000
0.208 | 0.273
0.000 | 0.000
0.000 | 0.000
0.579 | 0.689
0.043 | 0.110
0.000 | 0.067
5peptides
spectra
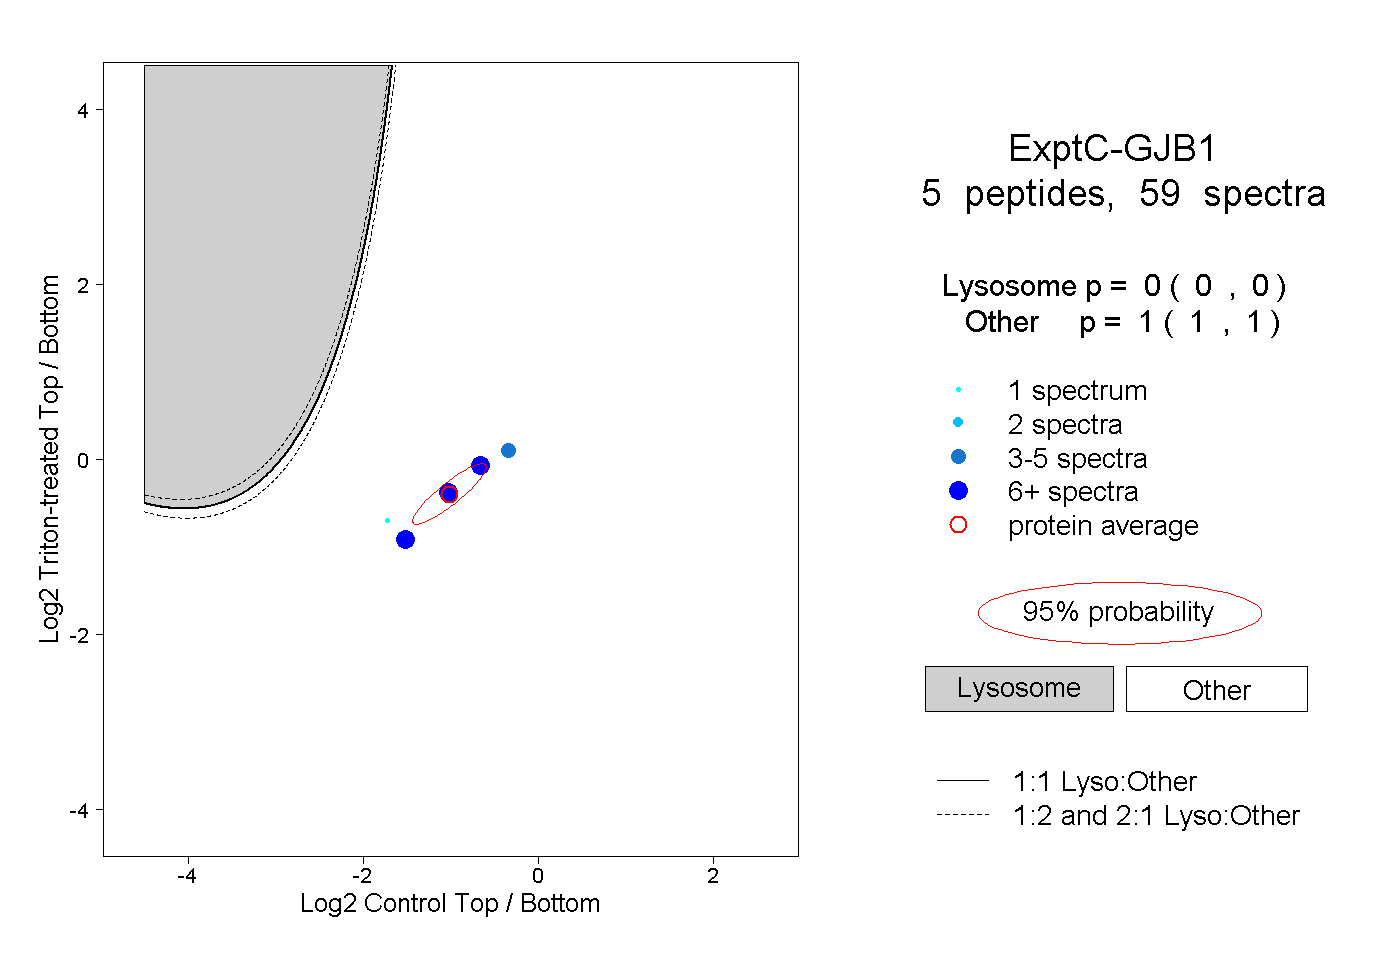
0.000 | 0.000
1.000 | 1.000
4peptides
spectra
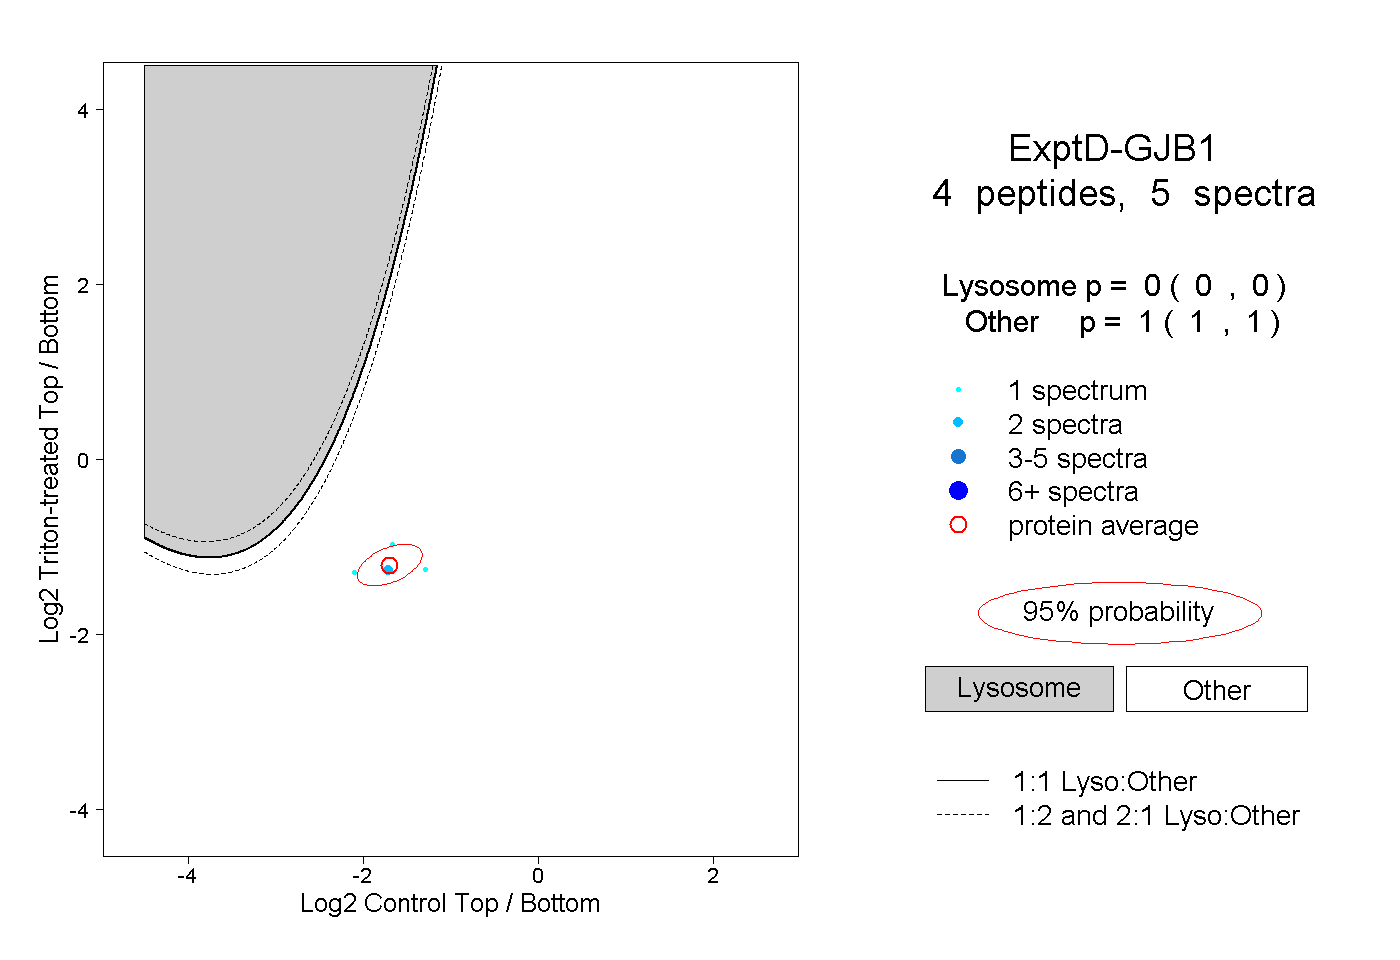
0.000 | 0.000
1.000 | 1.000