 6
6peptides
spectra
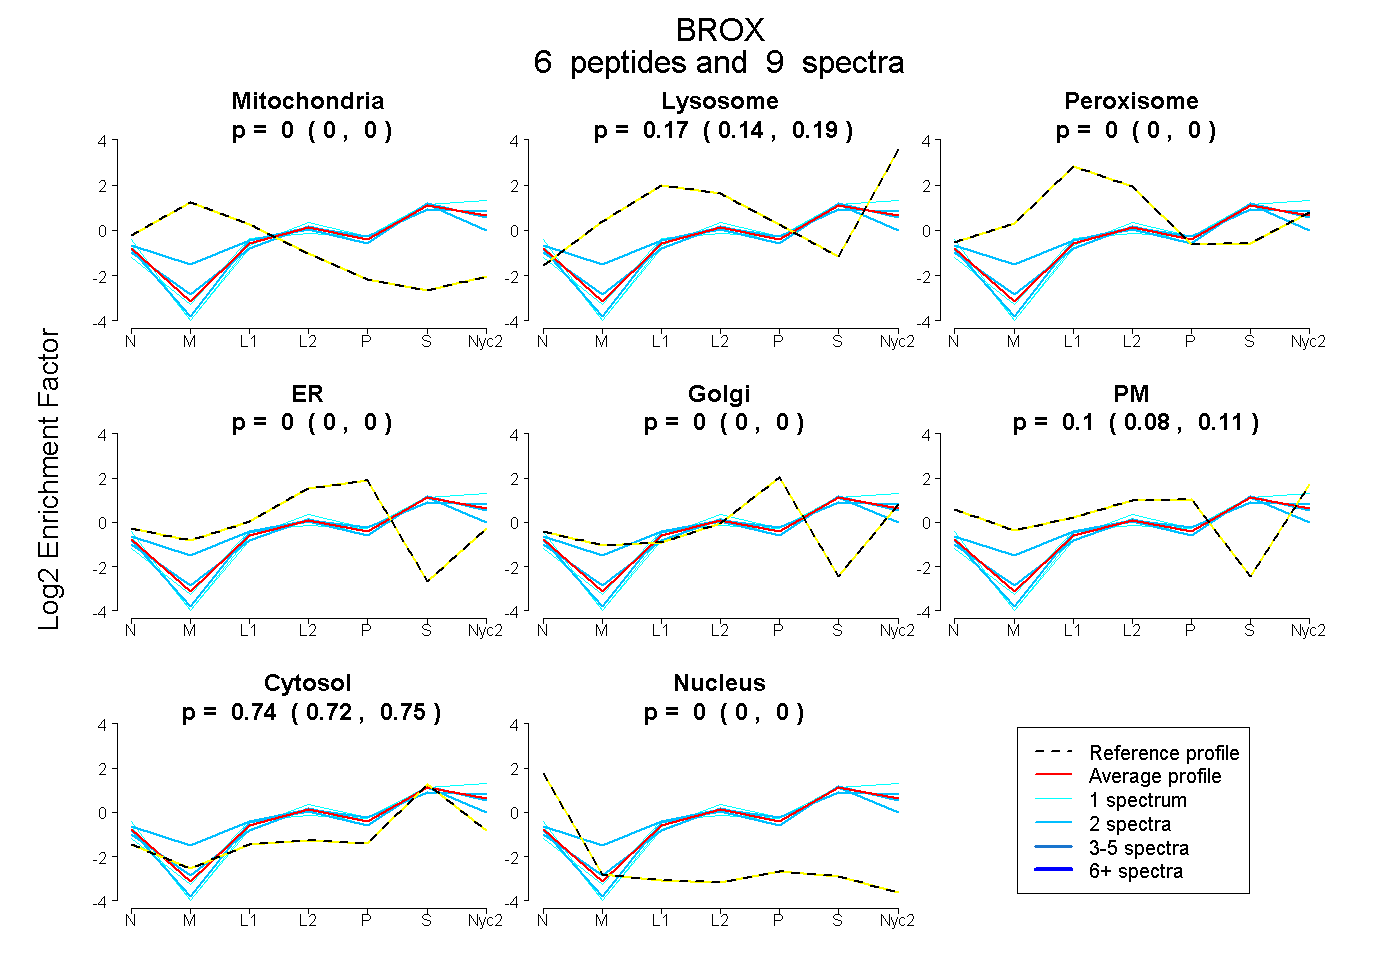
0.000 | 0.000
0.142 | 0.188
0.000 | 0.000
0.000 | 0.002
0.000 | 0.000
0.077 | 0.111
0.719 | 0.750
0.000 | 0.000
| Plot | Mito | Lyso | Perox | ER | Golgi | PM | Cytosol | Nucleus | |||||
| Expt A |
6 peptides |
9 spectra |
|
0.000 0.000 | 0.000 |
0.168 0.142 | 0.188 |
0.000 0.000 | 0.000 |
0.000 0.000 | 0.002 |
0.000 0.000 | 0.000 |
0.096 0.077 | 0.111 |
0.736 0.719 | 0.750 |
0.000 0.000 | 0.000 |
| 2 spectra, YIQNFK | 0.000 | 0.241 | 0.022 | 0.000 | 0.000 | 0.137 | 0.600 | 0.000 | ||
| 2 spectra, THWFHR | 0.000 | 0.157 | 0.000 | 0.000 | 0.000 | 0.051 | 0.792 | 0.000 | ||
| 1 spectrum, ENITEDEAK | 0.000 | 0.048 | 0.000 | 0.000 | 0.000 | 0.172 | 0.780 | 0.000 | ||
| 2 spectra, LYAEAEALCK | 0.000 | 0.115 | 0.000 | 0.123 | 0.000 | 0.000 | 0.762 | 0.000 | ||
| 1 spectrum, IPTEAPQLELK | 0.000 | 0.216 | 0.000 | 0.021 | 0.000 | 0.000 | 0.763 | 0.000 | ||
| 1 spectrum, ESHIPK | 0.000 | 0.184 | 0.000 | 0.000 | 0.000 | 0.098 | 0.718 | 0.000 |
| Plot | Lyso | Other | |||||||||||
| Expt C |
9 peptides |
20 spectra |
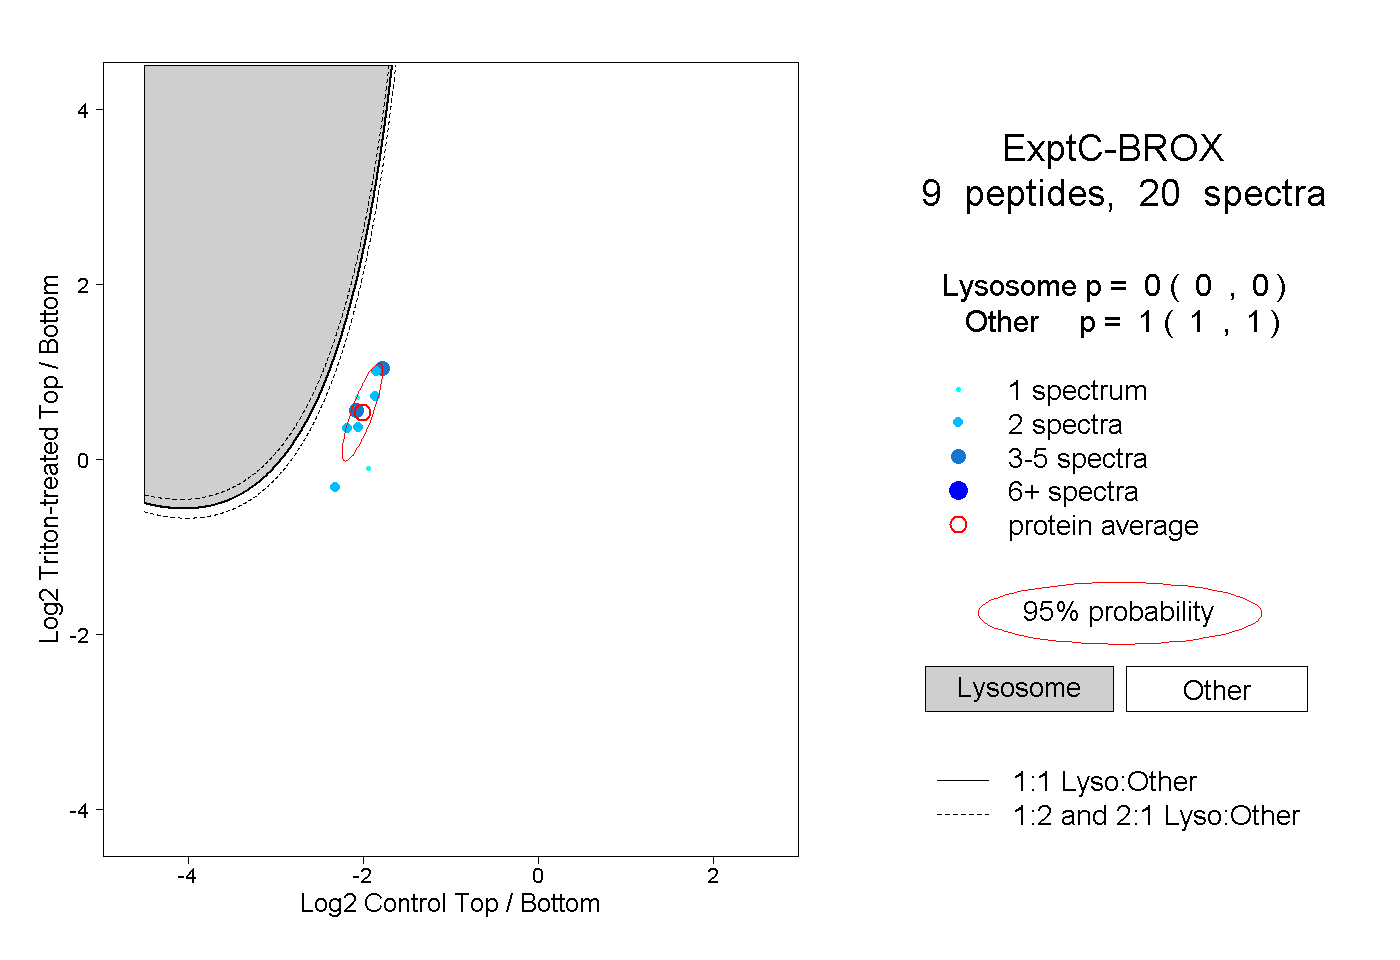 |
0.000 0.000 | 0.000 |
1.000 1.000 | 1.000 |
||||||||
| Plot | Lyso | Other | |||||||||||
| Expt D |
2 peptides |
2 spectra |
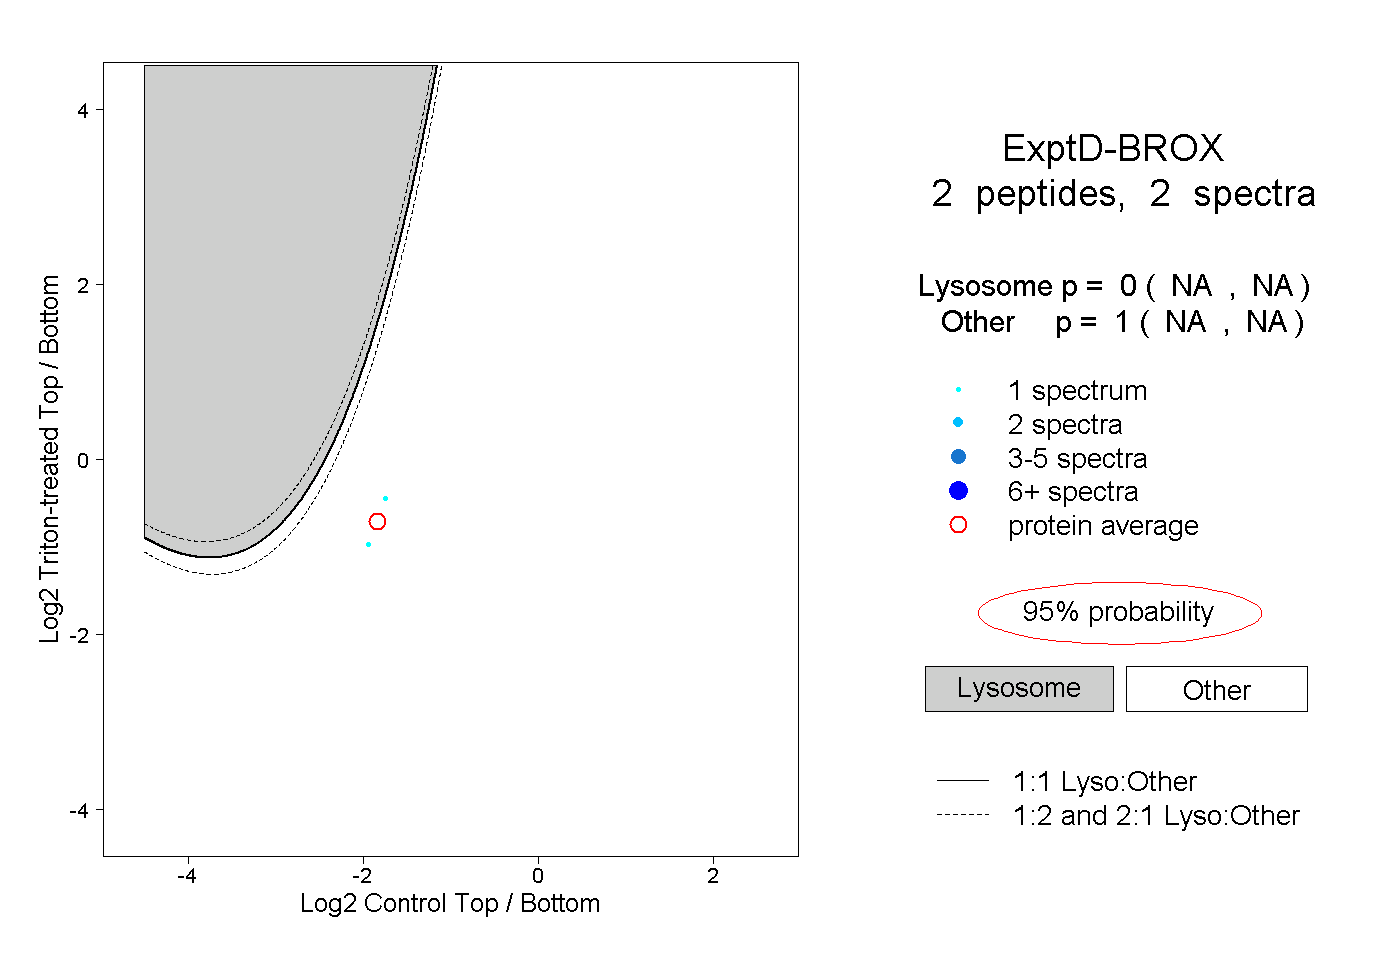 |
0.000 NA | NA |
1.000 NA | NA |