 4
4peptides
spectra
0.858 | 0.906
0.000 | 0.026
0.030 | 0.093
0.000 | 0.000
0.000 | 0.000
0.000 | 0.059
0.000 | 0.035
0.000 | 0.016
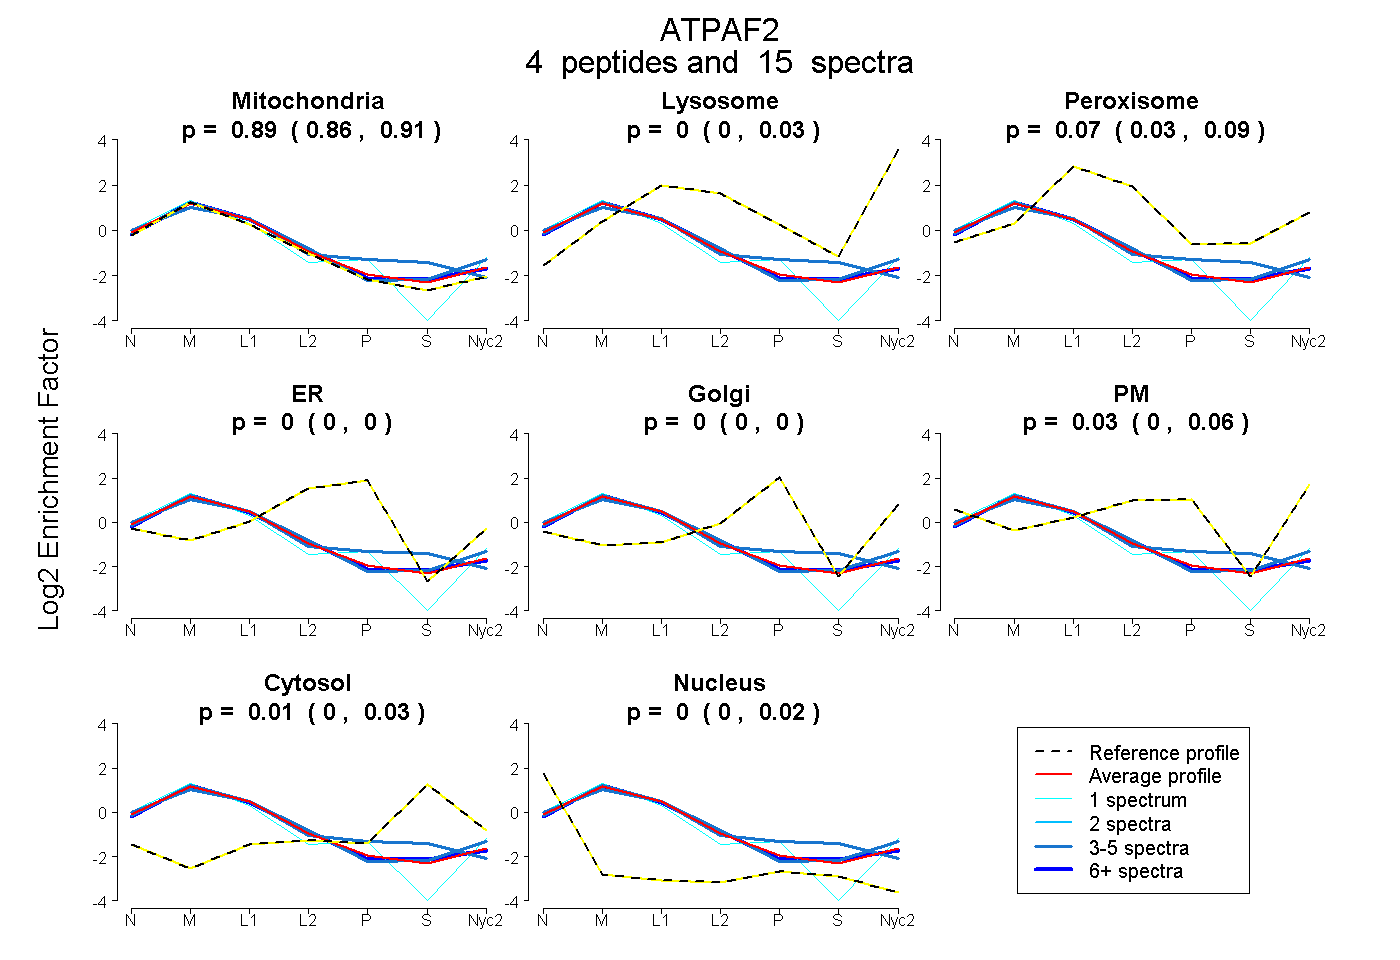
| Plot | Mito | Lyso | Perox | ER | Golgi | PM | Cytosol | Nucleus | |||||
| Expt A |
4 peptides |
15 spectra |
|
0.886 0.858 | 0.906 |
0.000 0.000 | 0.026 |
0.069 0.030 | 0.093 |
0.000 0.000 | 0.000 |
0.000 0.000 | 0.000 |
0.032 0.000 | 0.059 |
0.012 0.000 | 0.035 |
0.001 0.000 | 0.016 |
| 7 spectra, FLDTDTICYR | 0.884 | 0.000 | 0.088 | 0.000 | 0.000 | 0.000 | 0.028 | 0.000 | ||
| 4 spectra, VEEPETLVELQK | 0.864 | 0.064 | 0.054 | 0.000 | 0.000 | 0.000 | 0.018 | 0.000 | ||
| 1 spectrum, LEEEYQIQK | 0.836 | 0.000 | 0.000 | 0.000 | 0.082 | 0.081 | 0.000 | 0.000 | ||
| 3 spectra, NEWDPIIEWAEK | 0.774 | 0.000 | 0.089 | 0.012 | 0.000 | 0.000 | 0.125 | 0.000 |
| Plot | Mito | Lyso or Perox | ER | Golgi | PM | Cytosol | Nucleus | ||||||
| Expt B |
2 peptides |
2 spectra |
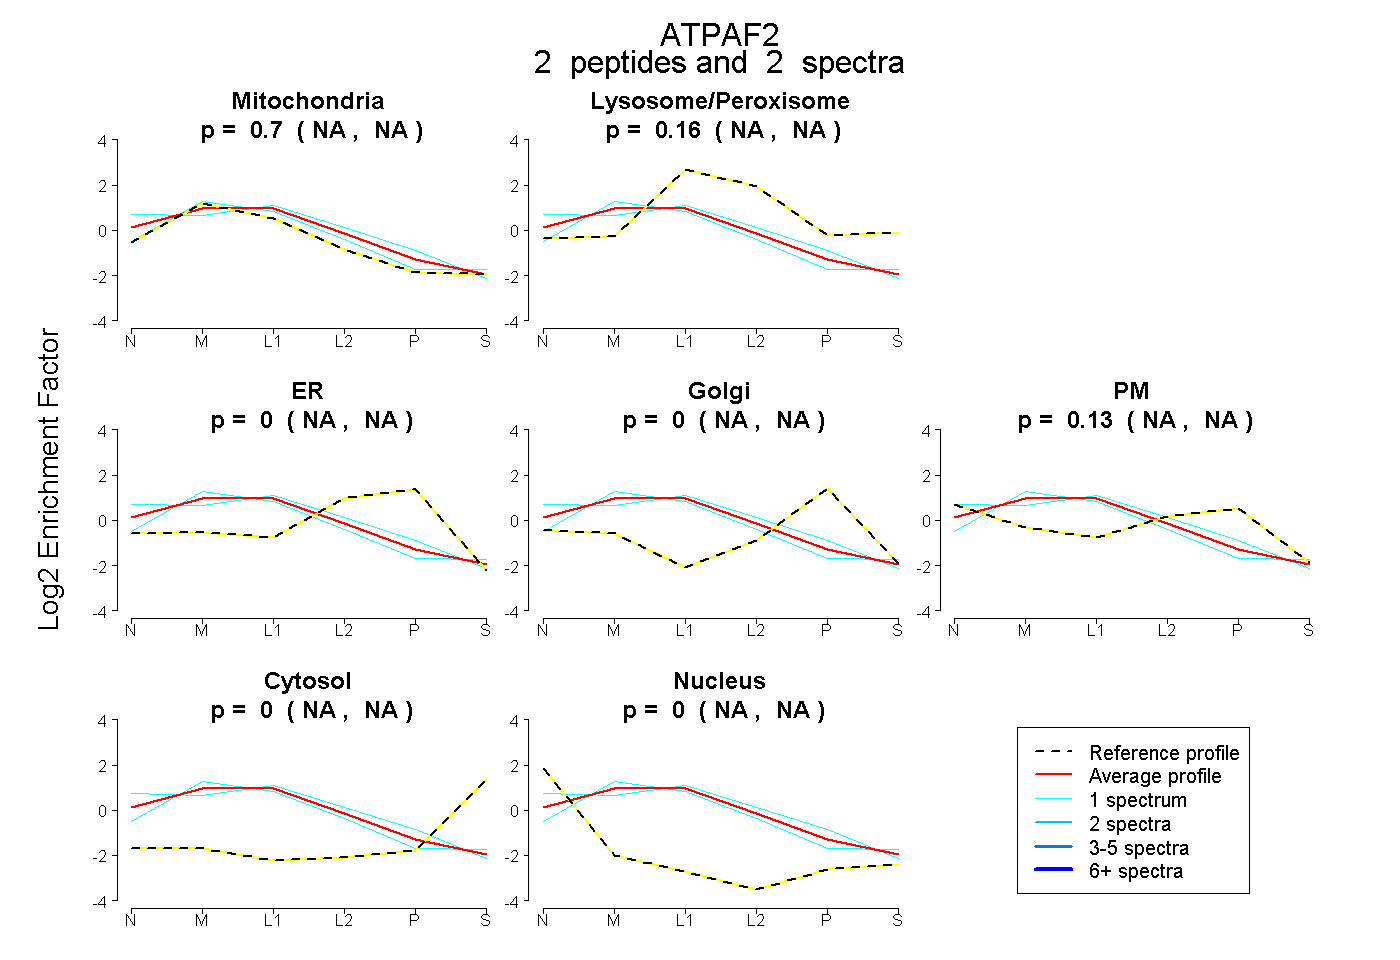 |
0.702 NA | NA |
0.164 NA | NA |
0.000 NA | NA |
0.000 NA | NA |
0.134 NA | NA |
0.000 NA | NA |
0.000 NA | NA |
|||
| Plot | Lyso | Other | |||||||||||
| Expt C |
5 peptides |
14 spectra |
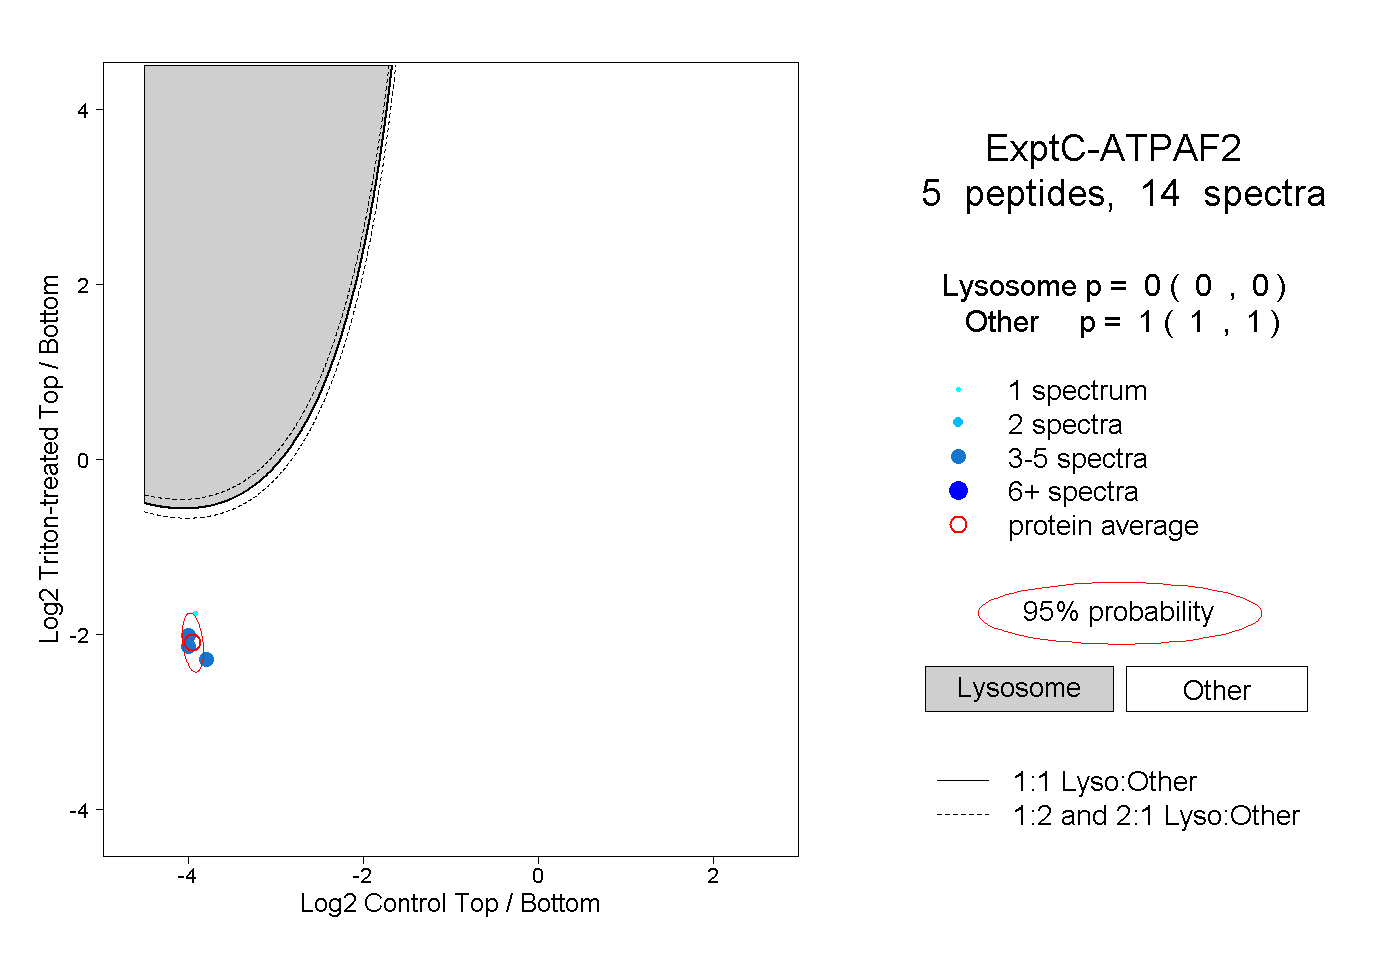 |
0.000 0.000 | 0.000 |
1.000 1.000 | 1.000 |
||||||||
| Plot | Lyso | Other | |||||||||||
| Expt D |
1 peptide |
1 spectrum |
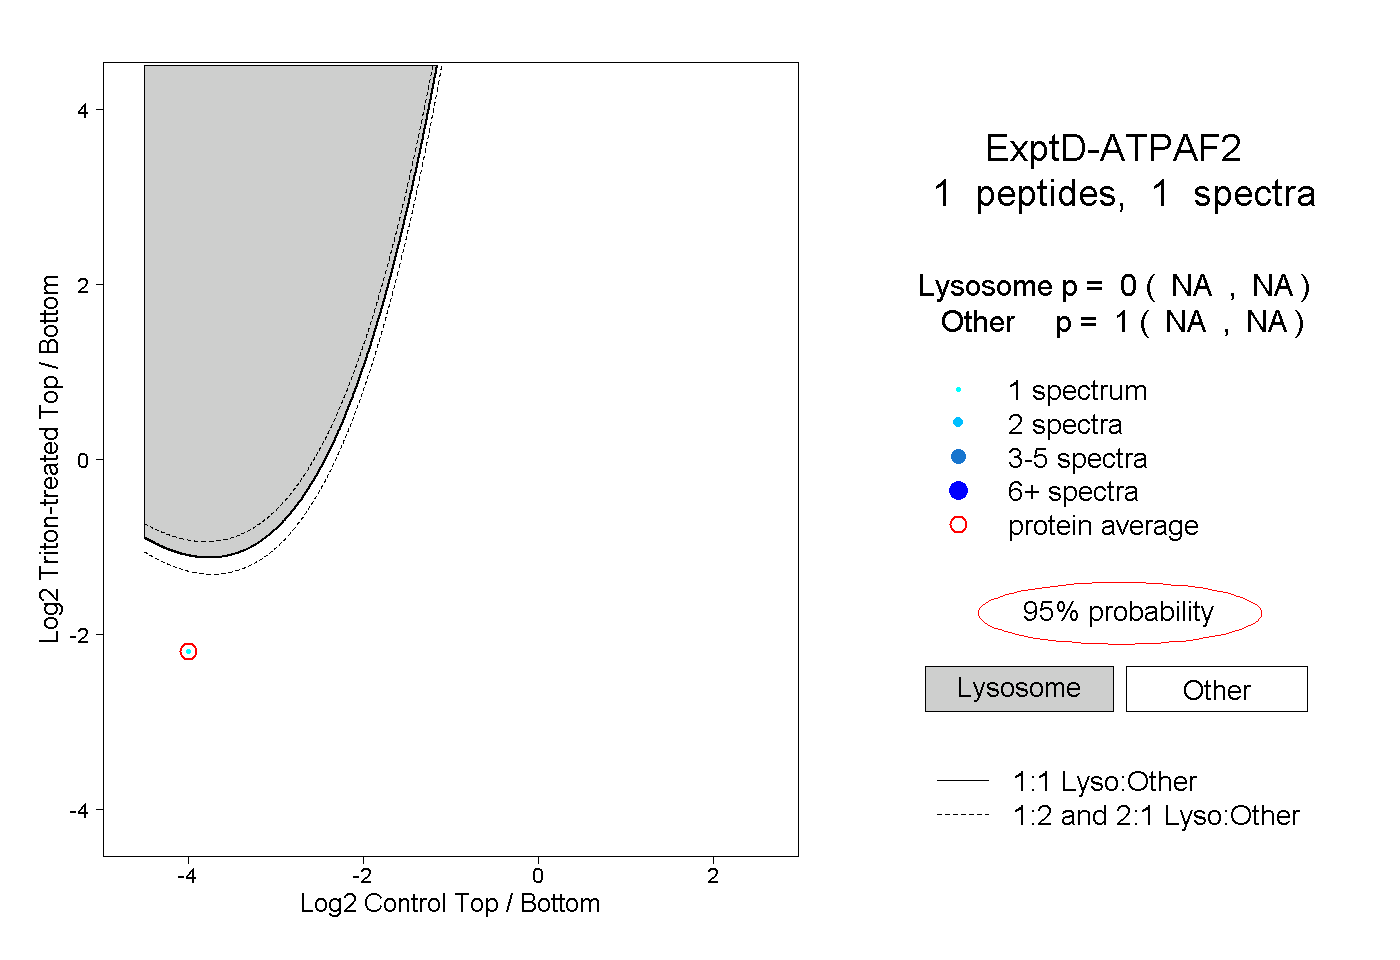 |
0.000 NA | NA |
1.000 NA | NA |